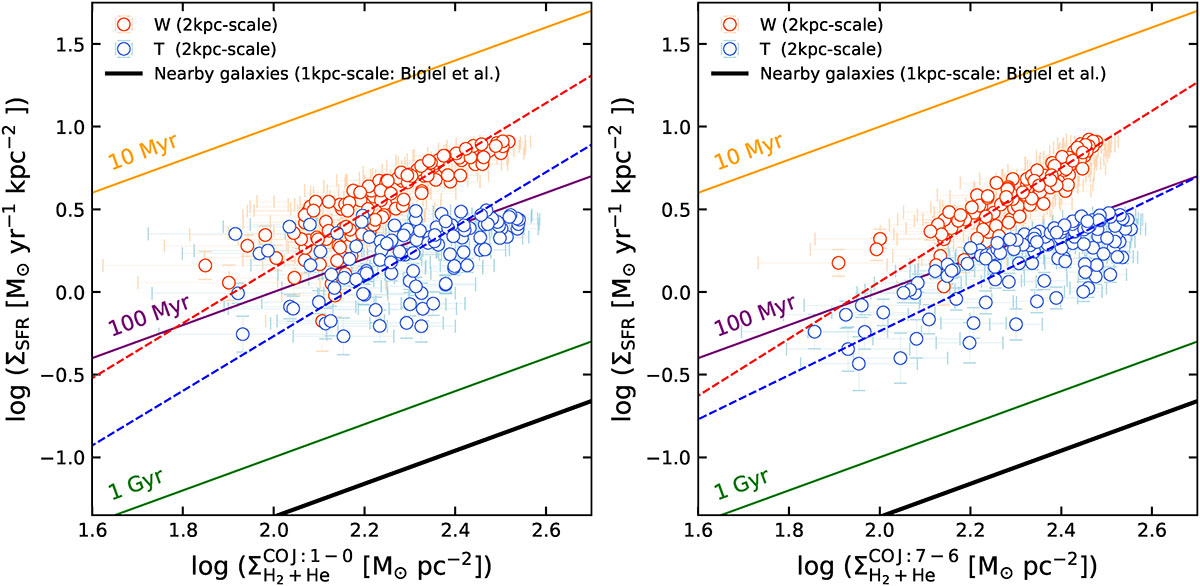
Fig. 16.
Download original image
Resolved SK relationship, i.e. the relationship between the surface densities of star formation and molecular gas, for galaxies W (red points) and T (blue points). The left (right) panel uses gas surface densities derived from the CO J:1-0 (CO J:7–6) emission line (see text). The SFR surface densities are derived from the rest-frame 1160 GHz continuum emission. Each data point was calculated over an aperture equivalent to the (FWHM) synthesised beam (roughly 2 kpc), with a spacing of half a synthesised beam between points, i.e. roughly a quarter of the points are independent measurements. The solid black line (bottom-right) is the kpc-scale resolved SK relationship in nearby ’normal’ galaxies from Bigiel et al. (2011). The orange, purple and green lines delineate gas exhaustion times of (top to bottom) 10 Myr, 100 Myr y 1 Gyr. The dashed blue and red lines show the best fits to our W and T data points. In the left panel (CO J:1-0) the slopes are 1.71 (± 0.26) for W (intercept −3.2) and 1.70 (± 0.24) for T (intercept −3.6). In the right panel (CO J:7-6) these are 1.72 (± 0.20) for W (intercept −3.4) and 1.66 (± 0.18) for T (intercept −2.9; see text). For galaxy T we used the observed (image plane) linear sizes corresponding to the synthesised beam; if the image plane is spatially stretched due to lensing then these points will move towards the top right, parallel to the gas exhaustion time lines.
Current usage metrics show cumulative count of Article Views (full-text article views including HTML views, PDF and ePub downloads, according to the available data) and Abstracts Views on Vision4Press platform.
Data correspond to usage on the plateform after 2015. The current usage metrics is available 48-96 hours after online publication and is updated daily on week days.
Initial download of the metrics may take a while.