Fig. 2.
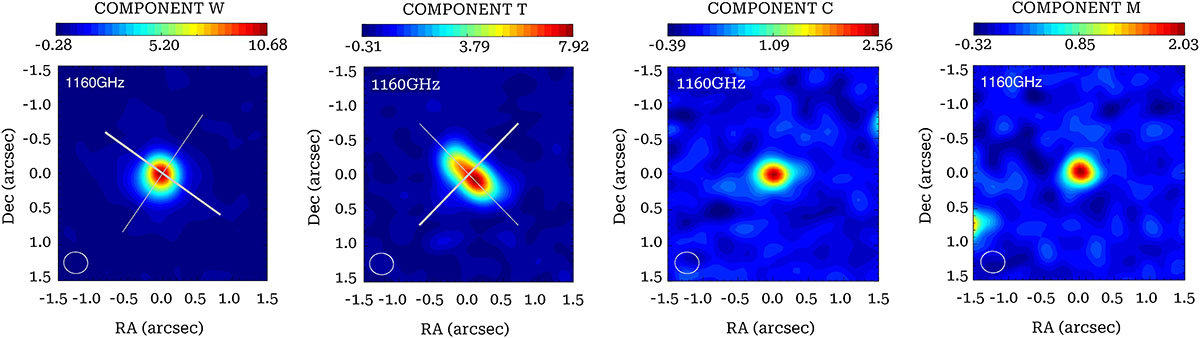
Download original image
Maps of the observed-frame 340-GHz (corresponding to rest-frame 260 μm) continuum emission in (left to right) galaxies W, T, C and M. Continuum fluxes are in mJy beam−1 following the colour bar above each panel. Each panel is 3″ × 3″ in size and the axes, in arcsec, are centred on the kinematic centre of each galaxy, as obtained from Kinemetry. These kinematic nuclear positions, hereafter used as the galaxy positions, are: W: 08:49:33.685, +02:14:44.680; T: 08:49:32.947, +02:14:39.696; C: 08:49:33.908, +02:14:44.860; M: 08:49:33.795, +02:14:45.595. For galaxies W and T, the kinematic major and minor axes are shown with thick and thin grey lines, respectively.
Current usage metrics show cumulative count of Article Views (full-text article views including HTML views, PDF and ePub downloads, according to the available data) and Abstracts Views on Vision4Press platform.
Data correspond to usage on the plateform after 2015. The current usage metrics is available 48-96 hours after online publication and is updated daily on week days.
Initial download of the metrics may take a while.