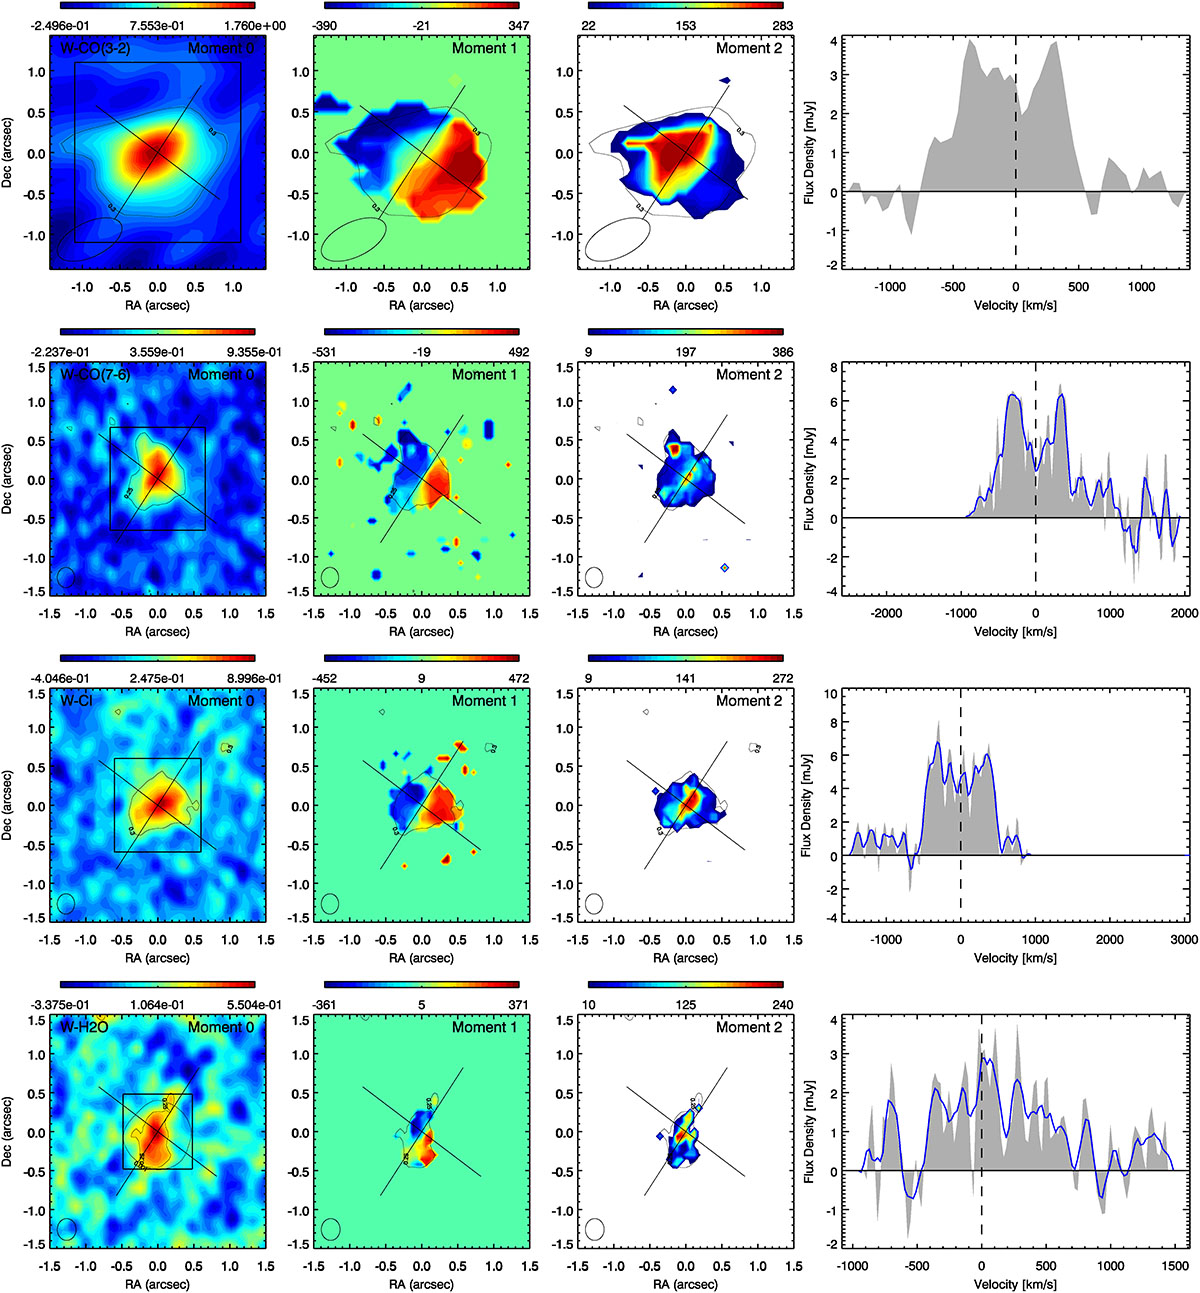
Fig. 3.
Download original image
Galaxy W. From left to right: Maps of the integrated flux (moment 0; units of Jy km s−1 beam−1), intensity-weighted average velocity (moment 1; km s−1 relative to systemic), velocity dispersion (moment 2; km s−1), and the galaxy-integrated line profile, of the detected emission lines. From top to bottom the lines are: CO J:3–2, CO J:7–6, [C I] 3P2→3P1, and H2O 211 − 202. In the three left-most columns, the colours follow the respective colour bars, the synthesised beam is shown at the lower left, and axis units are arcseconds with the same central position used in all panels. For ease, the kinematic major and minor axes are shown in solid black lines and a single specific flux contour from the moment 0 image is shown in all panels of the same row. All moment maps were made from natural-weighted data cubes. The right-most column shows the corresponding galaxy-integrated line profile extracted within the square aperture shown in the corresponding left-most panel. The line profiles are shown both at the observed spectral resolution (grey histograms; spectral resolutions of – top to bottom – 46 km s−1, 19.7 km s−1, 19.7 km s−1, and 21.2 km s−1, per channel), and at a smoothed resolution (blue solid lines in the lower three panels) of ∼100 km s−1. The line profiles of CO J:7–6 and [C I] 3P2→3P1 have been de-blended as is explained in Sect. 4.1.
Current usage metrics show cumulative count of Article Views (full-text article views including HTML views, PDF and ePub downloads, according to the available data) and Abstracts Views on Vision4Press platform.
Data correspond to usage on the plateform after 2015. The current usage metrics is available 48-96 hours after online publication and is updated daily on week days.
Initial download of the metrics may take a while.