Fig. 5.
Download original image
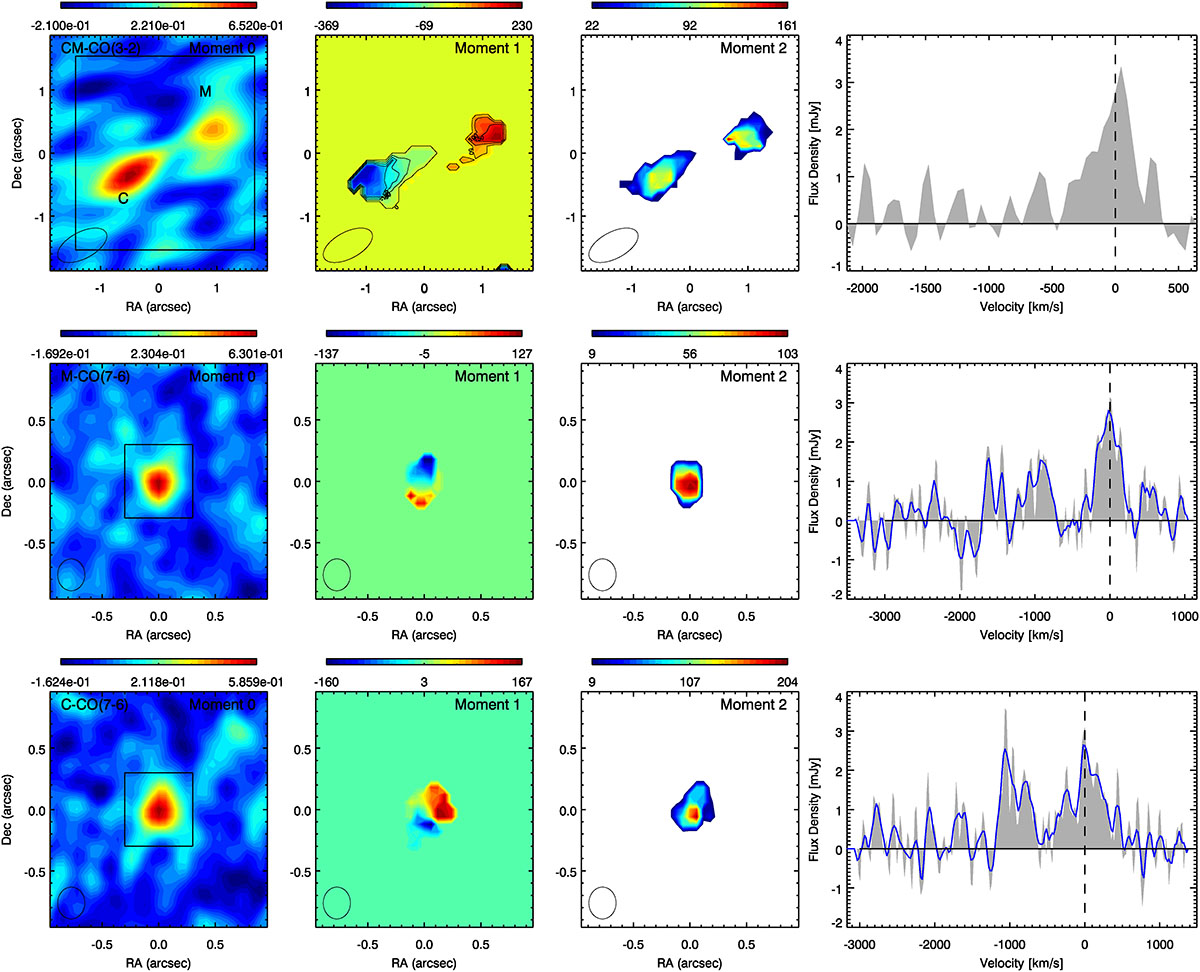
Similar to Fig. 3 but for galaxies M and C. The top row shows the results for the CO J:3–2 line in both M and C together. The middle and bottom rows show the results for the CO J:7–6 line separately for M and C, respectively. In the right-most panels of the middle and bottom rows (the galaxy-integrated profiles of the CO J:7–6 lines in M and C, respectively) the CO J:7–6 line covers a velocity range of approximately ±300 km s−1 and 500 km s−1, respectively; for both galaxies the [C I] 3P2→3P1 line is also clearly visible at lower (∼1000 km s−1 to the blue) velocities. We do not show the equivalent moment maps for the [C I] 3P2→3P1 line in M and C as they are significantly noisier.
Current usage metrics show cumulative count of Article Views (full-text article views including HTML views, PDF and ePub downloads, according to the available data) and Abstracts Views on Vision4Press platform.
Data correspond to usage on the plateform after 2015. The current usage metrics is available 48-96 hours after online publication and is updated daily on week days.
Initial download of the metrics may take a while.