Open Access
Fig. 6.
Download original image
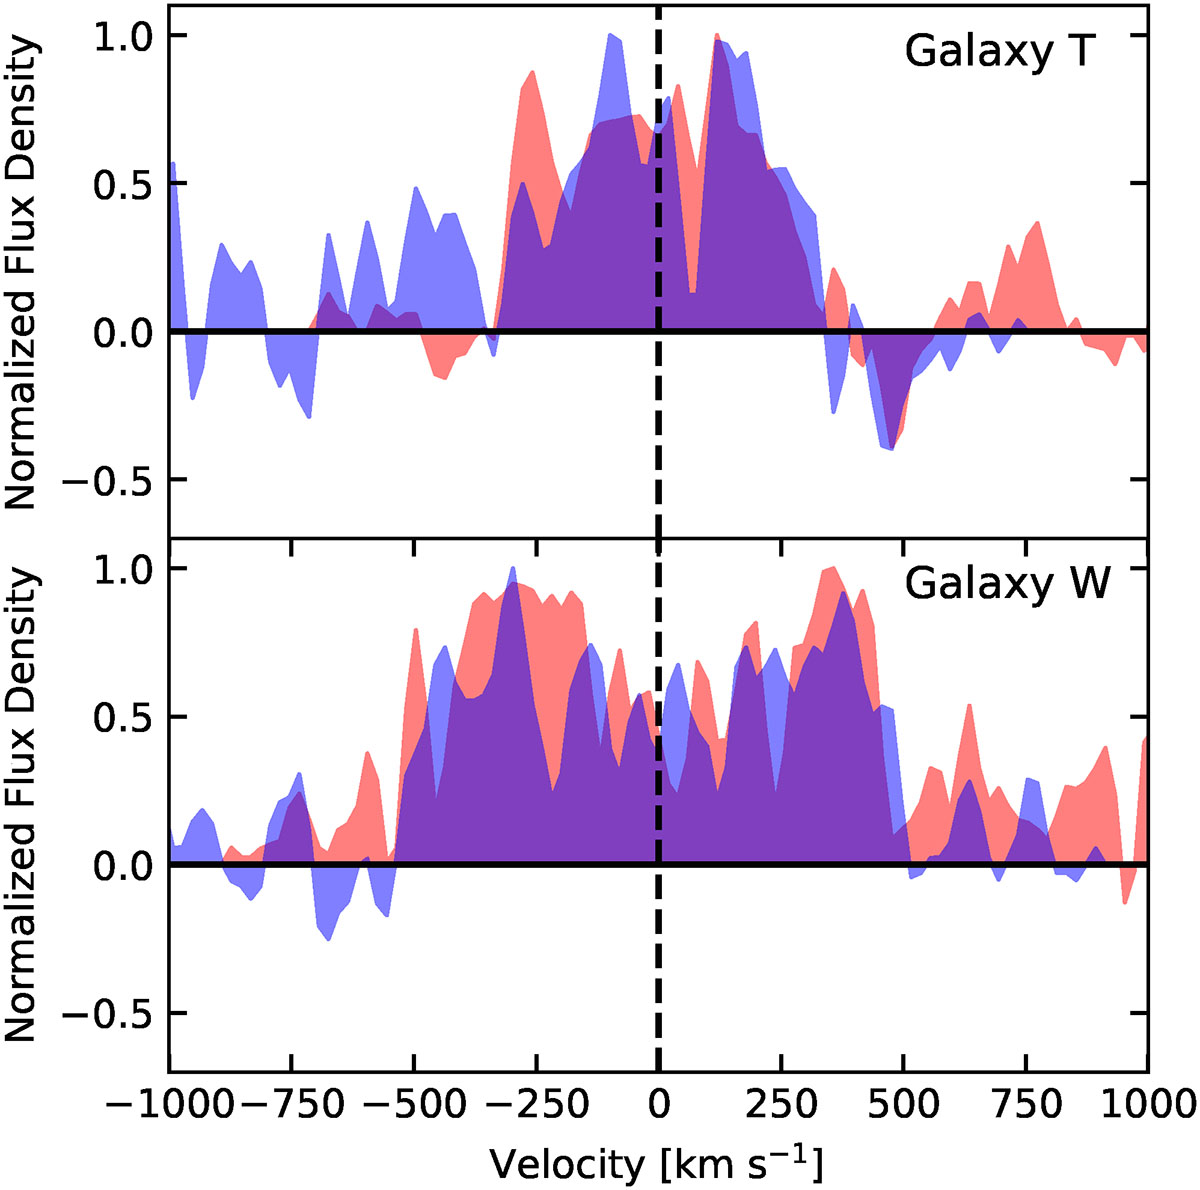
Comparison of the galaxy-integrated normalised spectral profiles of the CO J:7–6 (red) and [C I] 2–1 (light blue) lines for galaxies T (top panel) and W (bottom panel). Overlap regions of the two spectra appear darker blue. The dashed black line shows our adopted zero velocity.
Current usage metrics show cumulative count of Article Views (full-text article views including HTML views, PDF and ePub downloads, according to the available data) and Abstracts Views on Vision4Press platform.
Data correspond to usage on the plateform after 2015. The current usage metrics is available 48-96 hours after online publication and is updated daily on week days.
Initial download of the metrics may take a while.