Fig. 8.
Download original image
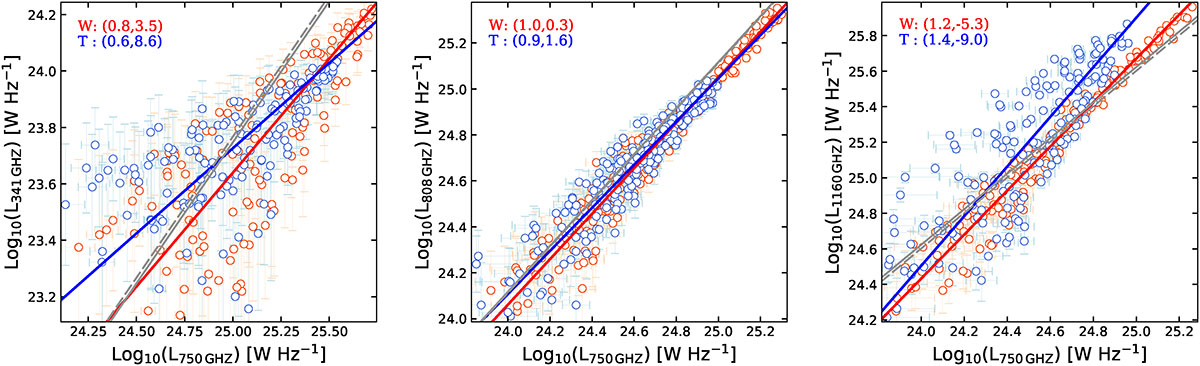
Relationships between the (resolved) continuum luminosities at rest-frame 341 GHz (880 μm), 750 GHz (400 μm), 808 GHz (370 μm), and 1160 GHz (260 μm) for galaxies W (red circles) and T (blue circles). The two maps used for each panel were convolved to a common resolution. Each data point was calculated over an aperture equivalent to the FWHM of the synthesised beam, with apertures spaced by half a synthesised beam; i.e. roughly a quarter of the data points are independent measurements. Error bars for each point are shown in light red and light blue for galaxies W and T, respectively. The solid lines in the corresponding colour delineate the linear fits to the data; the coefficients of these fits (slope, intercept) are listed in the panel in the corresponding colour. The grey lines show the expected relationships for greybody emission (with β = 2.0) for dust at temperature, Tdust = 40 K (solid) and 36 K (dashed), the estimated dust temperatures derived by I13 for W and T, respectively.
Current usage metrics show cumulative count of Article Views (full-text article views including HTML views, PDF and ePub downloads, according to the available data) and Abstracts Views on Vision4Press platform.
Data correspond to usage on the plateform after 2015. The current usage metrics is available 48-96 hours after online publication and is updated daily on week days.
Initial download of the metrics may take a while.