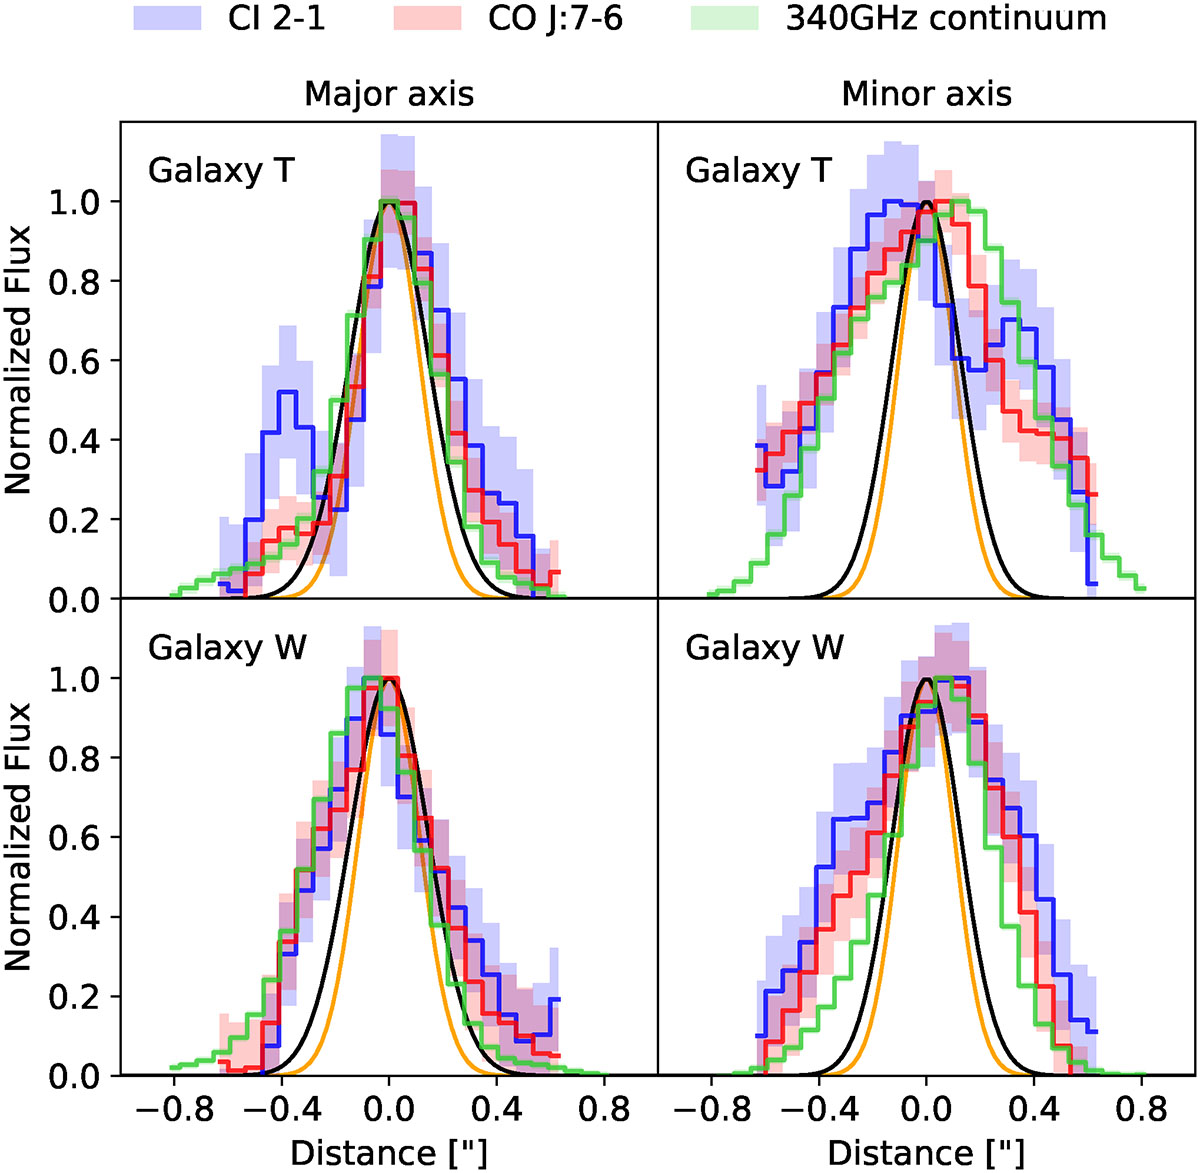
Fig. 9.
Download original image
Spatial extent of the CO J:7–6 and [C I] 2–1 emission lines and rest-frame 1160-GHz continuum emission in galaxy T (top row) and galaxy W (bottom row) along the kinematic major (PA = 135° for T and PA = 55° for W; left panels) and kinematic minor axes (right panels). Each panel shows the normalised flux, extracted along a one-pixel-wide slit oriented along the corresponding PA, of the observed-frame 340 GHz continuum emission (green), and the CO J:7–6 (red) and [C I] 2–1 (blue) emission lines. The shaded region with the corresponding colour delineates the 1σ noise in the neighbourhood of each extracted pixel. The major axis of the synthesised beam of the CO J:7–6 and [C I] 2–1 maps (340-GHz continuum map) is shown by the orange (black) normalised Gaussian; both synthesised beams are close to circular. Both lines and continuum are clearly resolved in all panels, with similar extensions in both emission lines and the continuum. The deconvolved sizes along these PAs are listed in Tables 4 and 5.
Current usage metrics show cumulative count of Article Views (full-text article views including HTML views, PDF and ePub downloads, according to the available data) and Abstracts Views on Vision4Press platform.
Data correspond to usage on the plateform after 2015. The current usage metrics is available 48-96 hours after online publication and is updated daily on week days.
Initial download of the metrics may take a while.