Fig. 1
Download original image
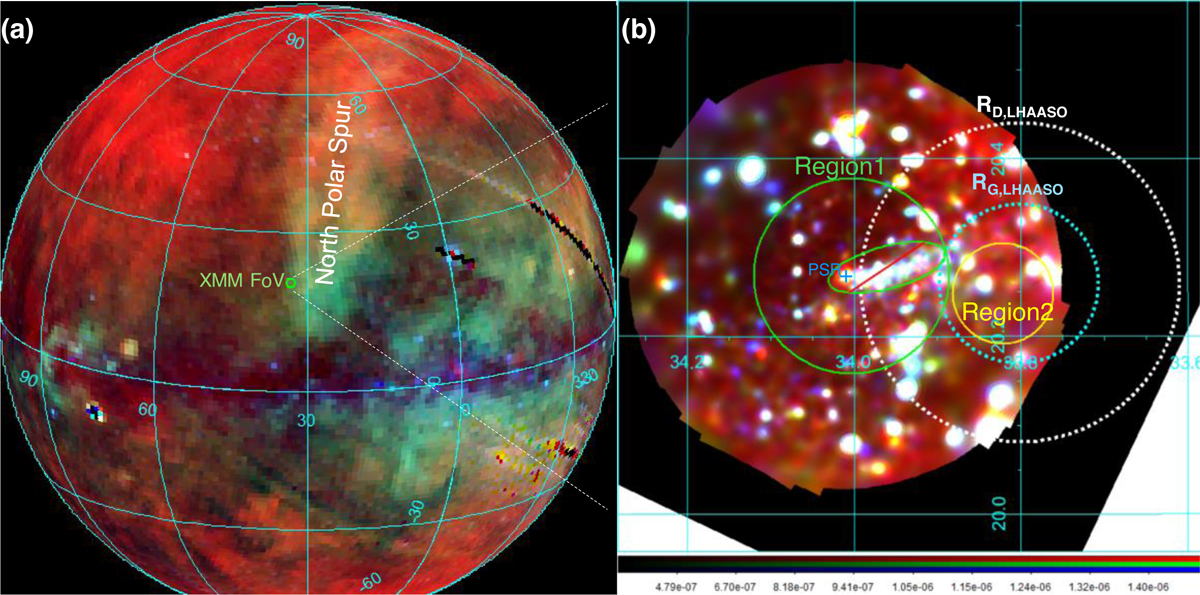
(a) ROSAT all-sky map showing the large-scale diffuse emission of the North Polar Spur and the location of the XMM-Newton pointings, i.e. the small green circle. The red, green and blue colours represent the 0.11-0.28 keV, 0.47-1.21 keV and 0.76-2.04 keV energy bands, respectively. (b) Image of the XMM-Newton FoV, showing both Region 1 and Region 2 (solid circles), and 1LHAASO J1740+0948u (dashed circles). The plotted radii of the source are taken from the 1 σ extension of the Gaussian (RG,LHAASO) and the diffuse (RD,LHAASO) models for photon energy above 25 TeV, shown in LHAASO Collaboration (2025). The 0.5-1 keV band is shown in red, the green emission corresponds to the range 1-2 keV, and the range 2-4.5 keV is represented in blue. Note that the observed point sources were later removed during the diffuse emission analysis.
Current usage metrics show cumulative count of Article Views (full-text article views including HTML views, PDF and ePub downloads, according to the available data) and Abstracts Views on Vision4Press platform.
Data correspond to usage on the plateform after 2015. The current usage metrics is available 48-96 hours after online publication and is updated daily on week days.
Initial download of the metrics may take a while.