Fig. 6
Download original image
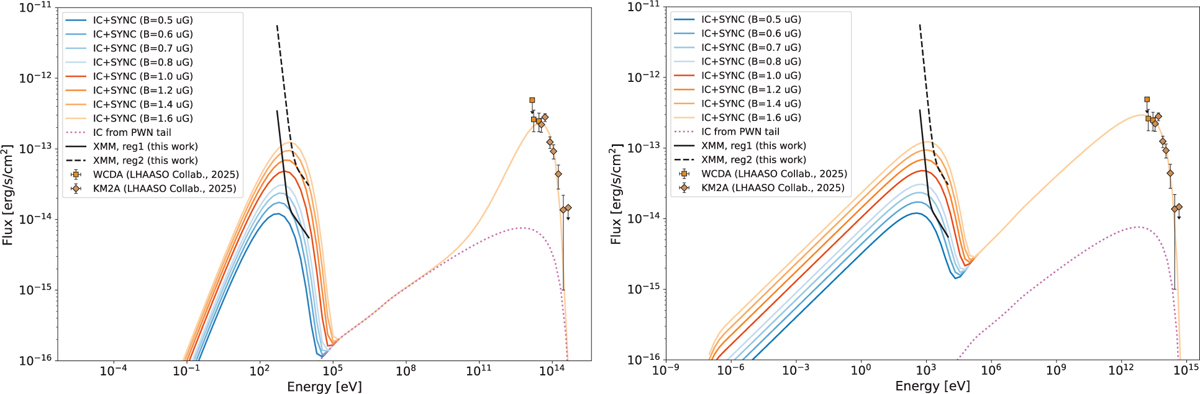
SED model of the LHAASO spectrum along with the X-ray ULs for Region 1 (solid UL) and Region 2 (dashed UL) using an ECPL distribution for the relativistic electrons generating the emission with fixed spectral index p. The contribution to the ICS from the X-ray tail is shown as the dash-dotted line. Values of the magnetic field between 0.5 μG and 1.6 μG are tested. Left panel : plot for p = 1.2. Right panel : plot for p = 2.4. In both panels, the upper limits were computed by rescaling the results to the area of the LHAASO region, assuming a radius of 0.147° as LHAASO Collaboration (2025).
Current usage metrics show cumulative count of Article Views (full-text article views including HTML views, PDF and ePub downloads, according to the available data) and Abstracts Views on Vision4Press platform.
Data correspond to usage on the plateform after 2015. The current usage metrics is available 48-96 hours after online publication and is updated daily on week days.
Initial download of the metrics may take a while.