Fig. 10
Download original image
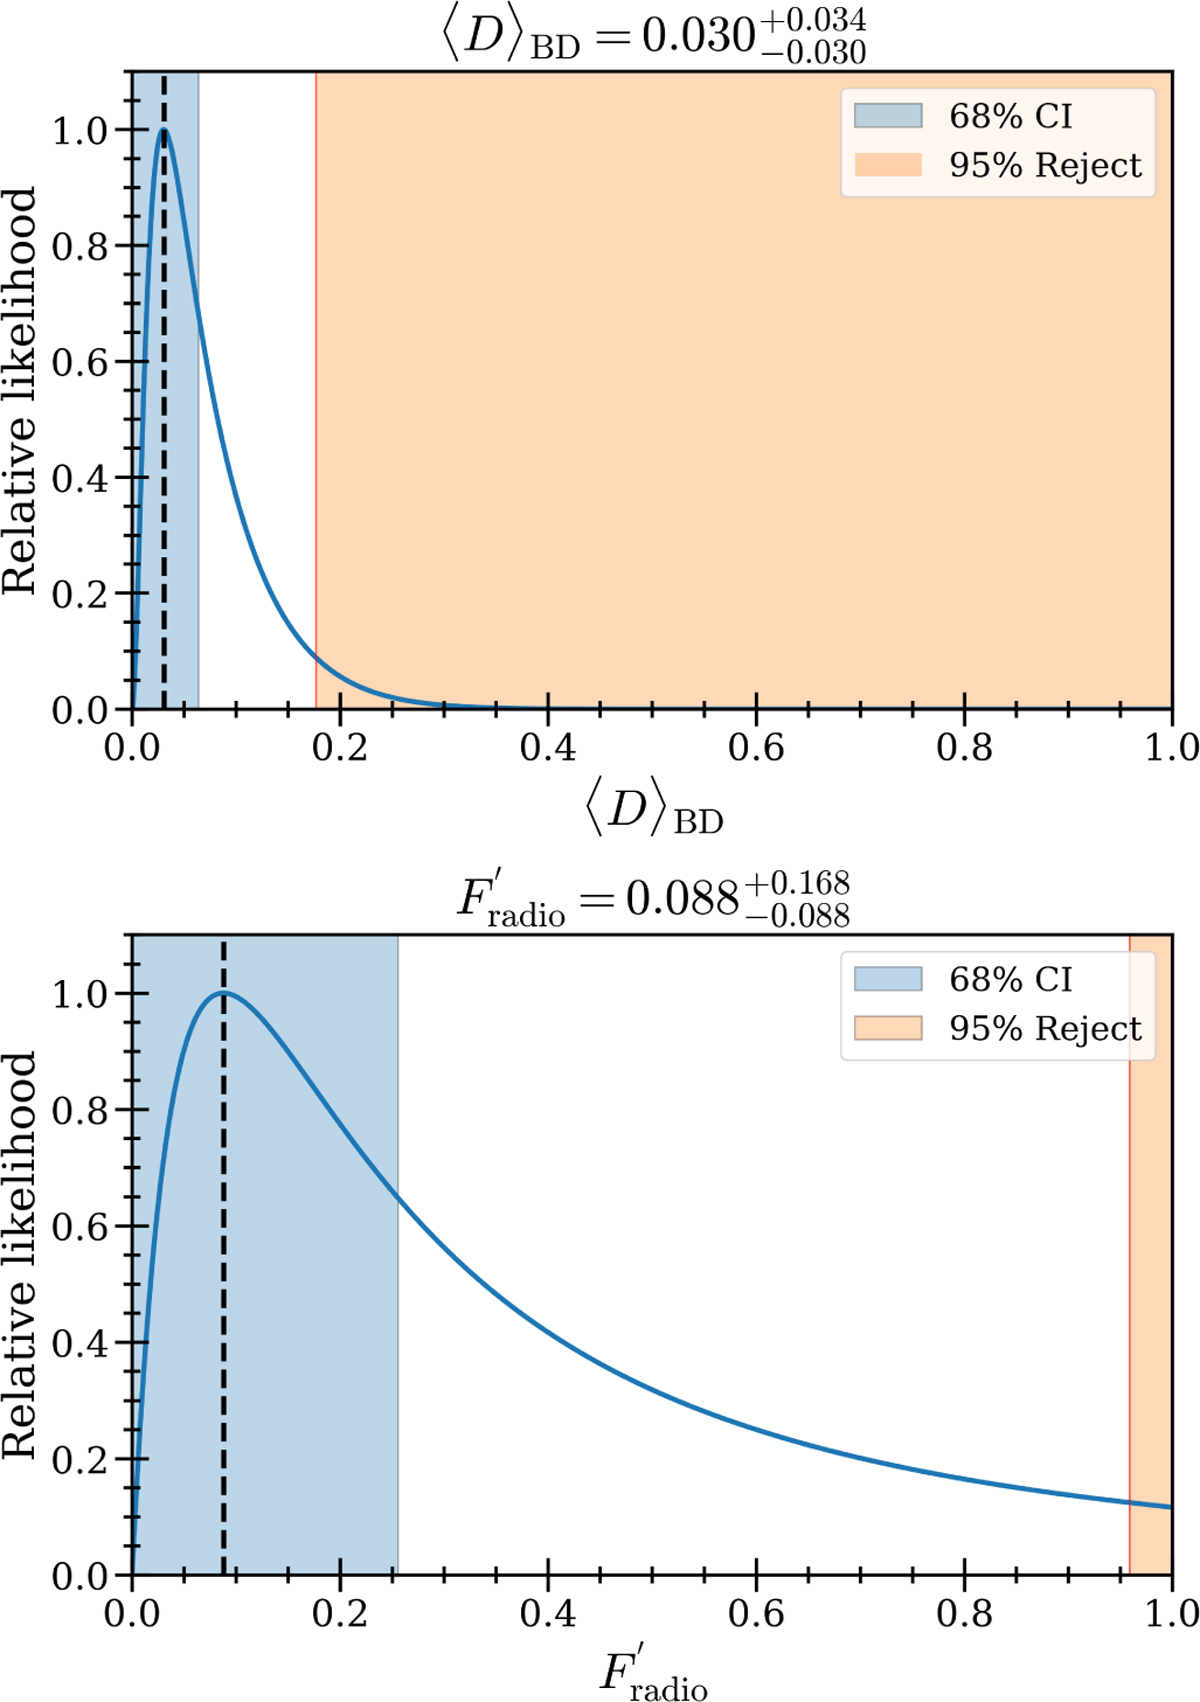
Marginal probability distribution functions of 〈D〉BD and F′radio. In each plot, the relative likelihood is defined such that it is unity at the dashed black line, corresponding to the most probable value of each parameter, i.e. ![]() and
and ![]() . The error bars of the parameters correspond to 68% confidence interval (CI), as represented by the blue-shaded region. The parameter value within orange shaded region can be rejected with ≥95%.
. The error bars of the parameters correspond to 68% confidence interval (CI), as represented by the blue-shaded region. The parameter value within orange shaded region can be rejected with ≥95%.
Current usage metrics show cumulative count of Article Views (full-text article views including HTML views, PDF and ePub downloads, according to the available data) and Abstracts Views on Vision4Press platform.
Data correspond to usage on the plateform after 2015. The current usage metrics is available 48-96 hours after online publication and is updated daily on week days.
Initial download of the metrics may take a while.