Fig. A.3
Download original image
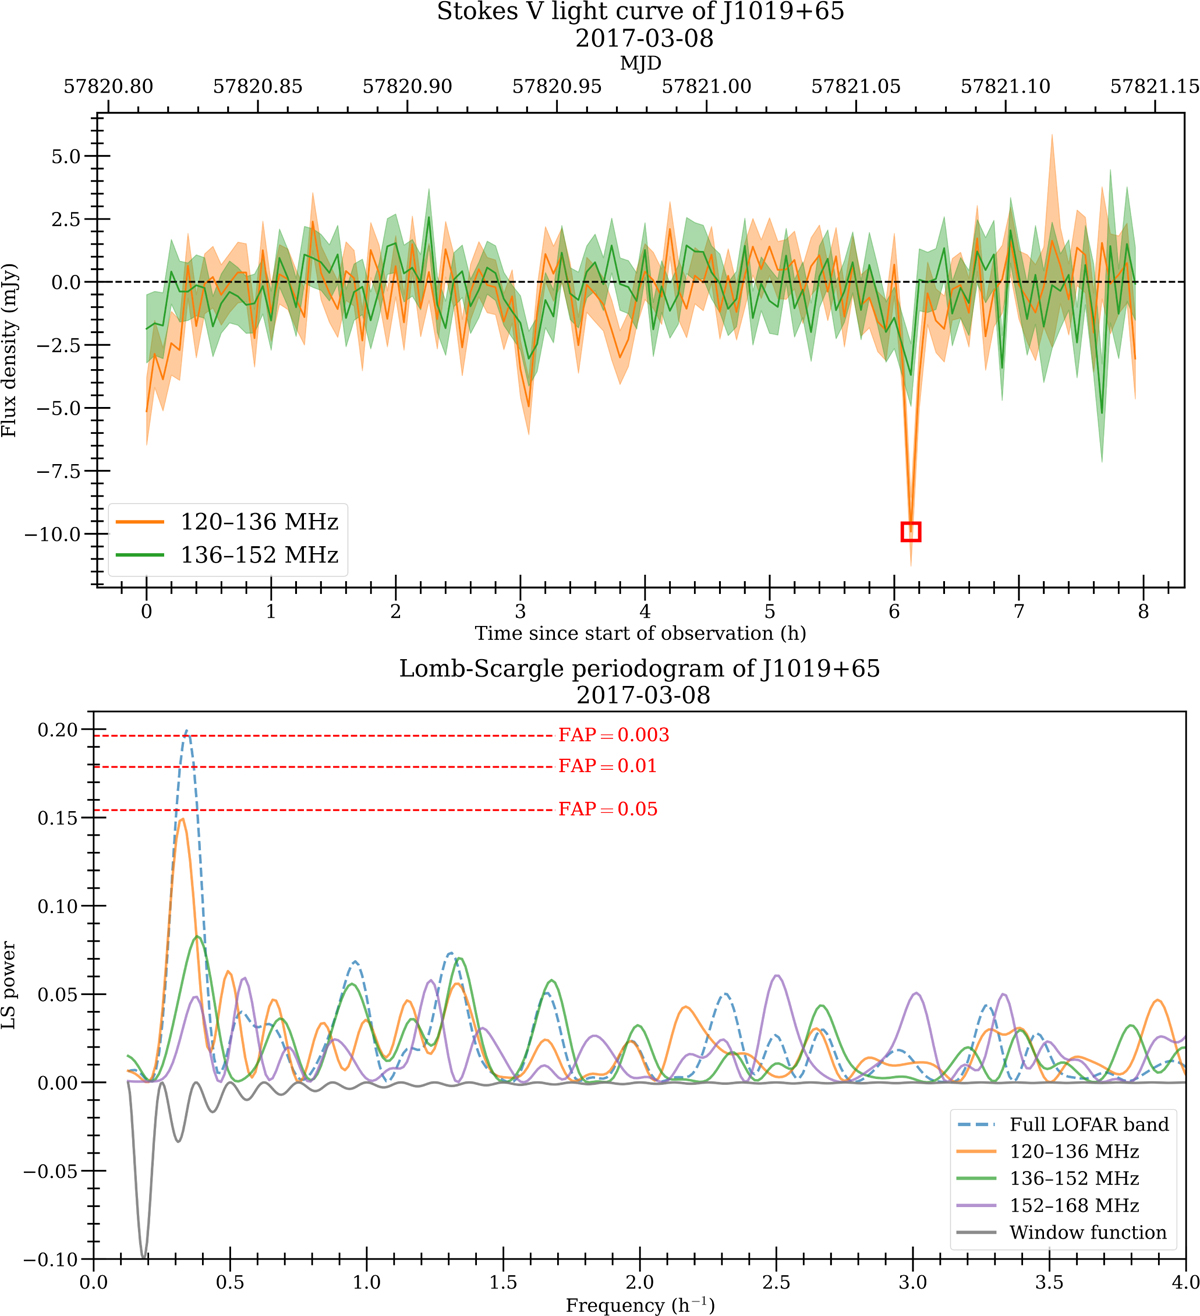
LOFAR observation of J1019+65 carried out on 2017-03-08 (i.e. LoTSS DR2 epoch). Top panel: Stokes V light curves with a cadence of 4 min at different frequencies. The shaded region represents ±1σ uncertainty. The negative ≈ 10mJy burst at 120-136 MHz (enclosed in red) has a signal-to-noise ratio of > 7. The light curve at 152-168 MHz is omitted for the sake of clarity. The top axis represents the time of observation in Modified Julian Dates (MJD). The dashed black line at 0mJy is drawn for clarity. Bottom panel: LS periodogram of the radio light curves. The three dashed red lines represent the necessary LS power (i.e. peak height) to achieve a false-alarm probability (FAP) of 5%, 1%, and 0.3%. The grey curve represents the (negative) LS periodogram of the window function, which is a light curve with the same timestamps as the original curve, but the flux density of each data point is replaced with unity (i.e. a flat light curve).
Current usage metrics show cumulative count of Article Views (full-text article views including HTML views, PDF and ePub downloads, according to the available data) and Abstracts Views on Vision4Press platform.
Data correspond to usage on the plateform after 2015. The current usage metrics is available 48-96 hours after online publication and is updated daily on week days.
Initial download of the metrics may take a while.