Fig. 2
Download original image
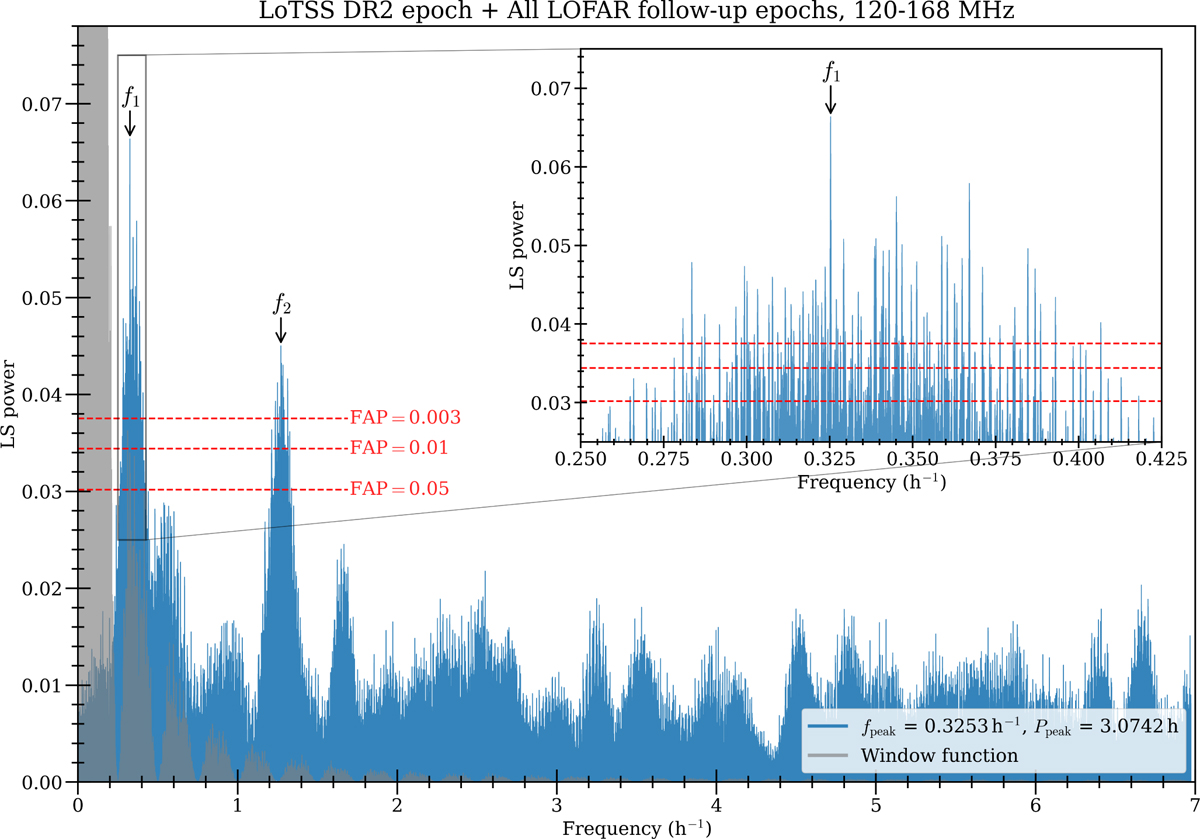
LS periodograms of the LOFAR cross-epoch radio light curve, which includes data from both the original LoTSS DR2 epoch and our ten LOFAR follow-up epochs. The spectrum reveals the peak at f1 ≈ 0.325 h−1 originally discovered by Vedantham et al. (2023). Another significant peak not previously discovered is detected at f2 ≈ 1.271 h−1, with a false alarm probability (FAP) of less than 0.3%. The locations of these two peaks are indicated by the black arrows. The three dashed red lines represent the FAP of different values. The grey curve represents the LS periodogram of the window function, which is a light curve with the same timestamps as the original curve; however, the flux density of each data point is replaced by unity (i.e. a flat light curve). The inset plot in each panel shows a zoomed-in version of the observed J1019+65 power spectrum in the vicinity of the tallest LS peak, with the same three FAP dashed red lines.
Current usage metrics show cumulative count of Article Views (full-text article views including HTML views, PDF and ePub downloads, according to the available data) and Abstracts Views on Vision4Press platform.
Data correspond to usage on the plateform after 2015. The current usage metrics is available 48-96 hours after online publication and is updated daily on week days.
Initial download of the metrics may take a while.