Fig. 5
Download original image
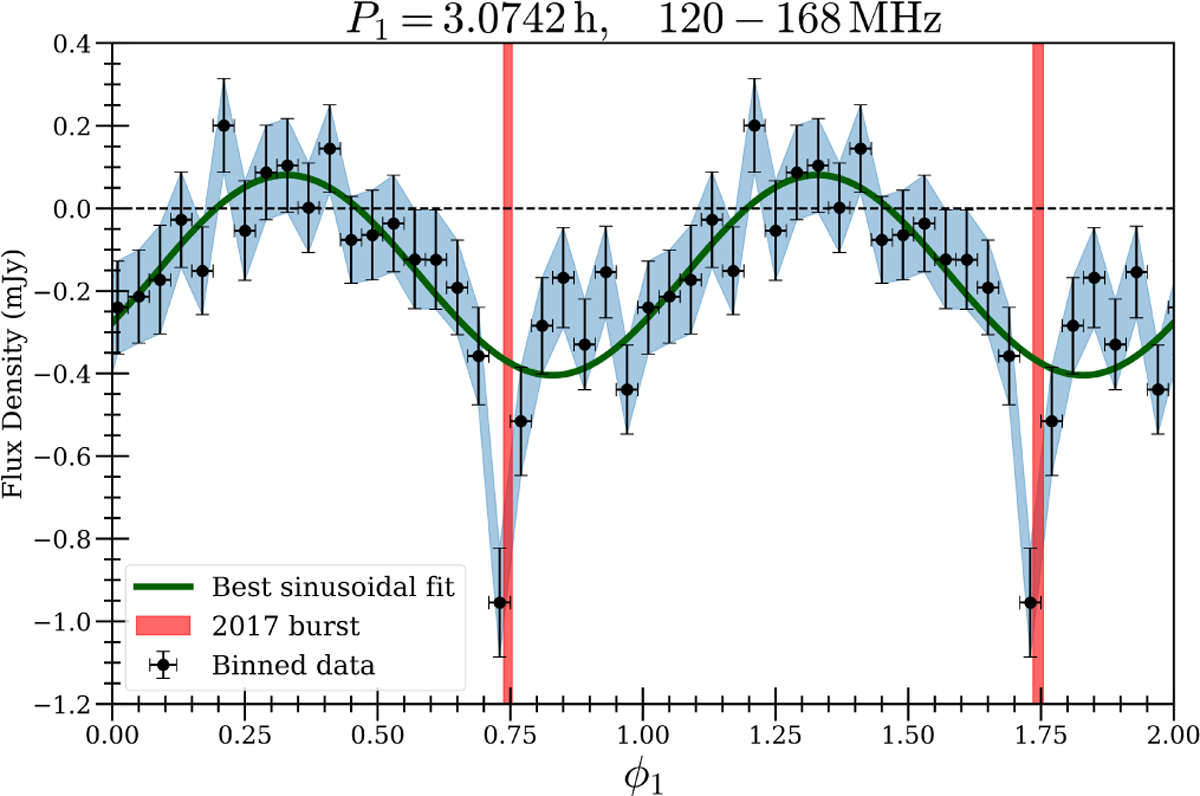
Stokes V cross-epoch (2017-2023) light curve of J1019+65 phase-folded at a period of P1 = 3.0742 h, corresponding to the f1 peak seen in Fig. 2. The light curve is binned at intervals of 0.04 in phase and one full period corresponds to a phase interval of unity. The choice of starting phase is arbitrary. The green line represents the best sinusoidal fit using the computed LS model. The J1019+65 radio burst shown in Fig. A.3 is also plotted as a red line (with its width representing the duration of the burst) to indicate at which phase relative to the phase-folded light curves does it correspond to. Note: the burst shown in red only occurs in one epoch out of the whole dataset. The dashed black line at 0 mJy is drawn for clarity.
Current usage metrics show cumulative count of Article Views (full-text article views including HTML views, PDF and ePub downloads, according to the available data) and Abstracts Views on Vision4Press platform.
Data correspond to usage on the plateform after 2015. The current usage metrics is available 48-96 hours after online publication and is updated daily on week days.
Initial download of the metrics may take a while.