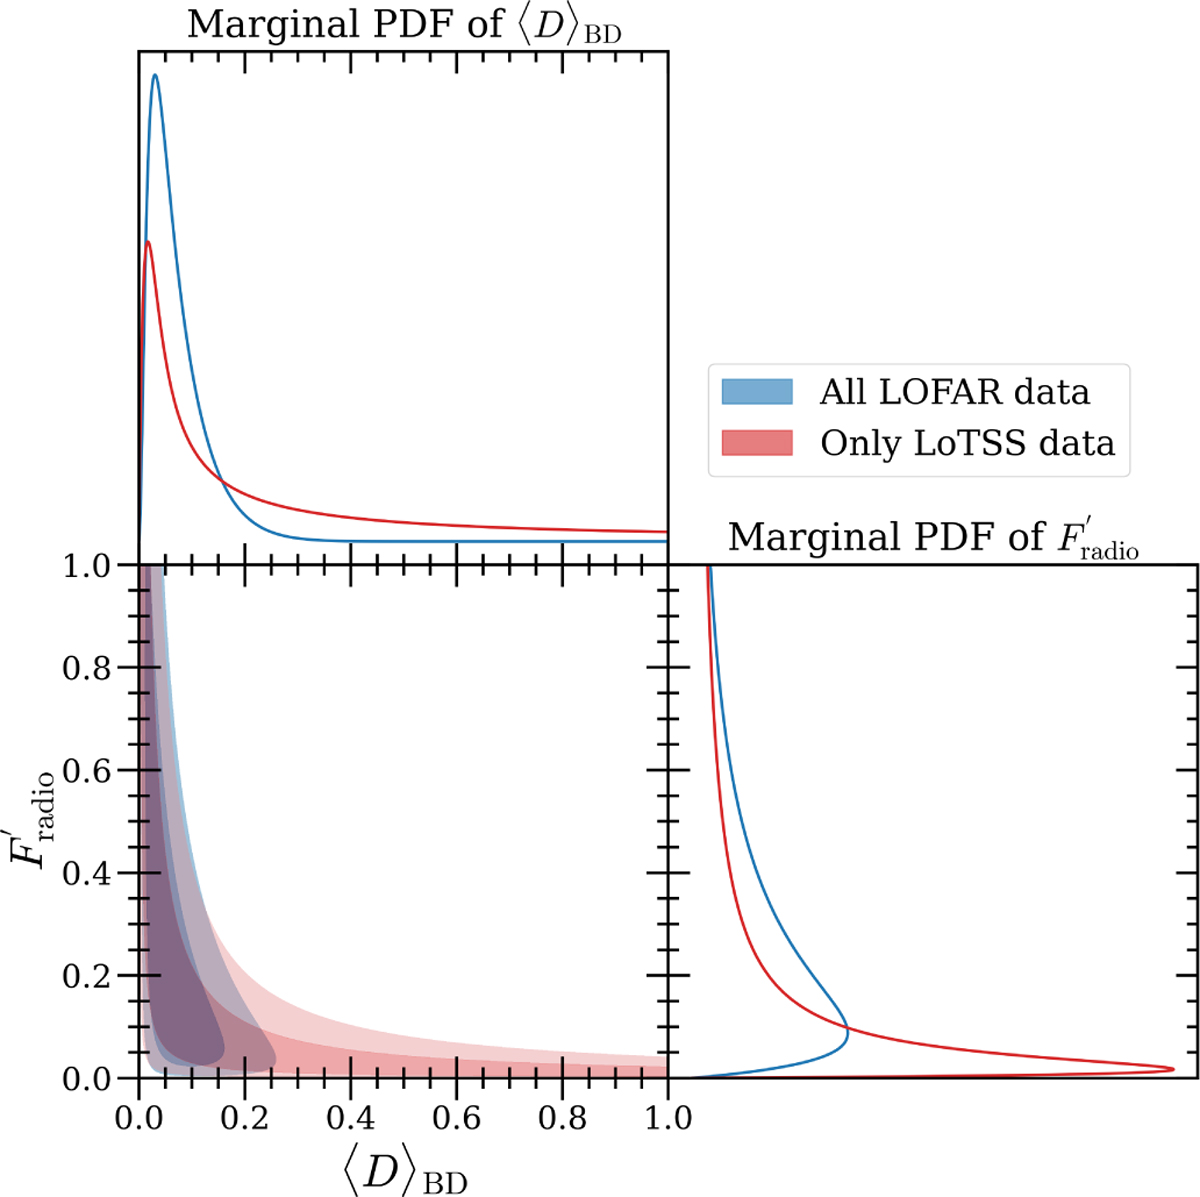
Fig. 9
Download original image
Corner plot showing the covariance of the joint probability distribution function (PDF) and marginal PDFs of the two parameters: the observed fraction of radio-loud brown dwarfs, F′radio, in our sample and its expected duty ratio, 〈D〉BD. Information plotted in red only considers the Poisson probability (Eq. (1)) derived from LoTSS DR2 observation, whereas information in blue also considers the binomial distribution (Eq. (2) multiplied by Eq. (1)) derived from the follow-up LOFAR data. The 2D distribution have contours indicating the regions containing 68% and 95%.
Current usage metrics show cumulative count of Article Views (full-text article views including HTML views, PDF and ePub downloads, according to the available data) and Abstracts Views on Vision4Press platform.
Data correspond to usage on the plateform after 2015. The current usage metrics is available 48-96 hours after online publication and is updated daily on week days.
Initial download of the metrics may take a while.