Fig. 4.
Download original image
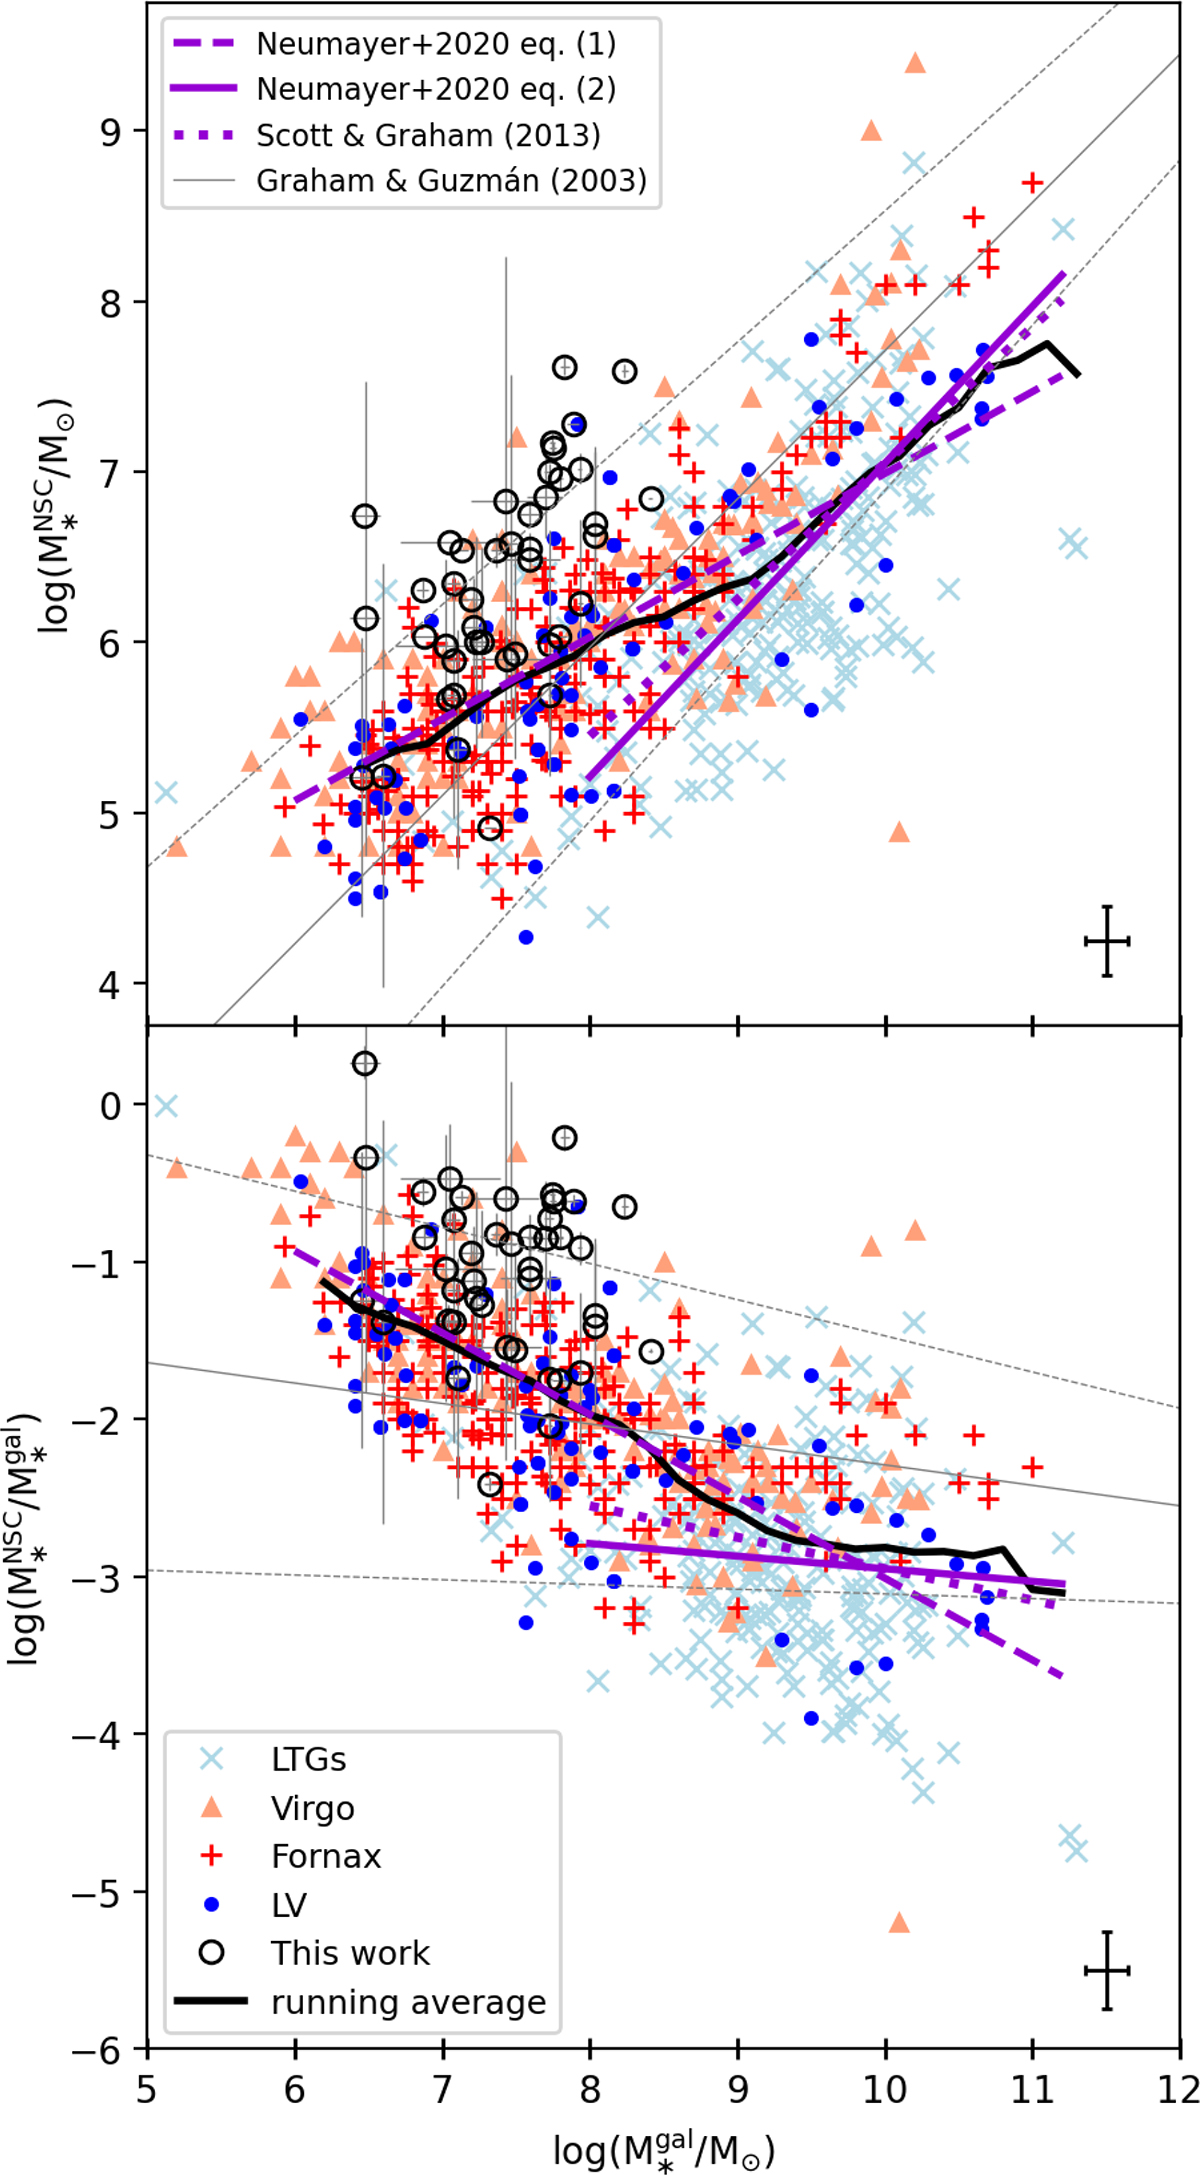
NSC stellar mass to galaxy stellar mass relation (top) and NSC-to-galaxy mass ratio vs. galaxy stellar mass (bottom) for the MATLAS NSCs from this work (black open circles), LV (blue dots), Virgo (orange triangles), Fornax (red crosses), and LTG (light blue crosses) photometry-based sample from Sect. 6.1. We computed the running average of log M![]() in bins with a width of 1 dex and a moving step size of 0.2 dex in log M
in bins with a width of 1 dex and a moving step size of 0.2 dex in log M![]() considering all the NSCs (black solid line). In the bottom plot, we compare the running average to Eqs. (1) (purple dashed line) and (2) (purple line) of Neumayer et al. (2020), as well as the relation found for ETGs in Scott & Graham (2013) (purple dotted line) and dEs in Graham & Guzmán (2003) (gray line; with dashed lines for the errors). The error bars (lower right corner) represent the median uncertainties.
considering all the NSCs (black solid line). In the bottom plot, we compare the running average to Eqs. (1) (purple dashed line) and (2) (purple line) of Neumayer et al. (2020), as well as the relation found for ETGs in Scott & Graham (2013) (purple dotted line) and dEs in Graham & Guzmán (2003) (gray line; with dashed lines for the errors). The error bars (lower right corner) represent the median uncertainties.
Current usage metrics show cumulative count of Article Views (full-text article views including HTML views, PDF and ePub downloads, according to the available data) and Abstracts Views on Vision4Press platform.
Data correspond to usage on the plateform after 2015. The current usage metrics is available 48-96 hours after online publication and is updated daily on week days.
Initial download of the metrics may take a while.