Fig. 5.
Download original image
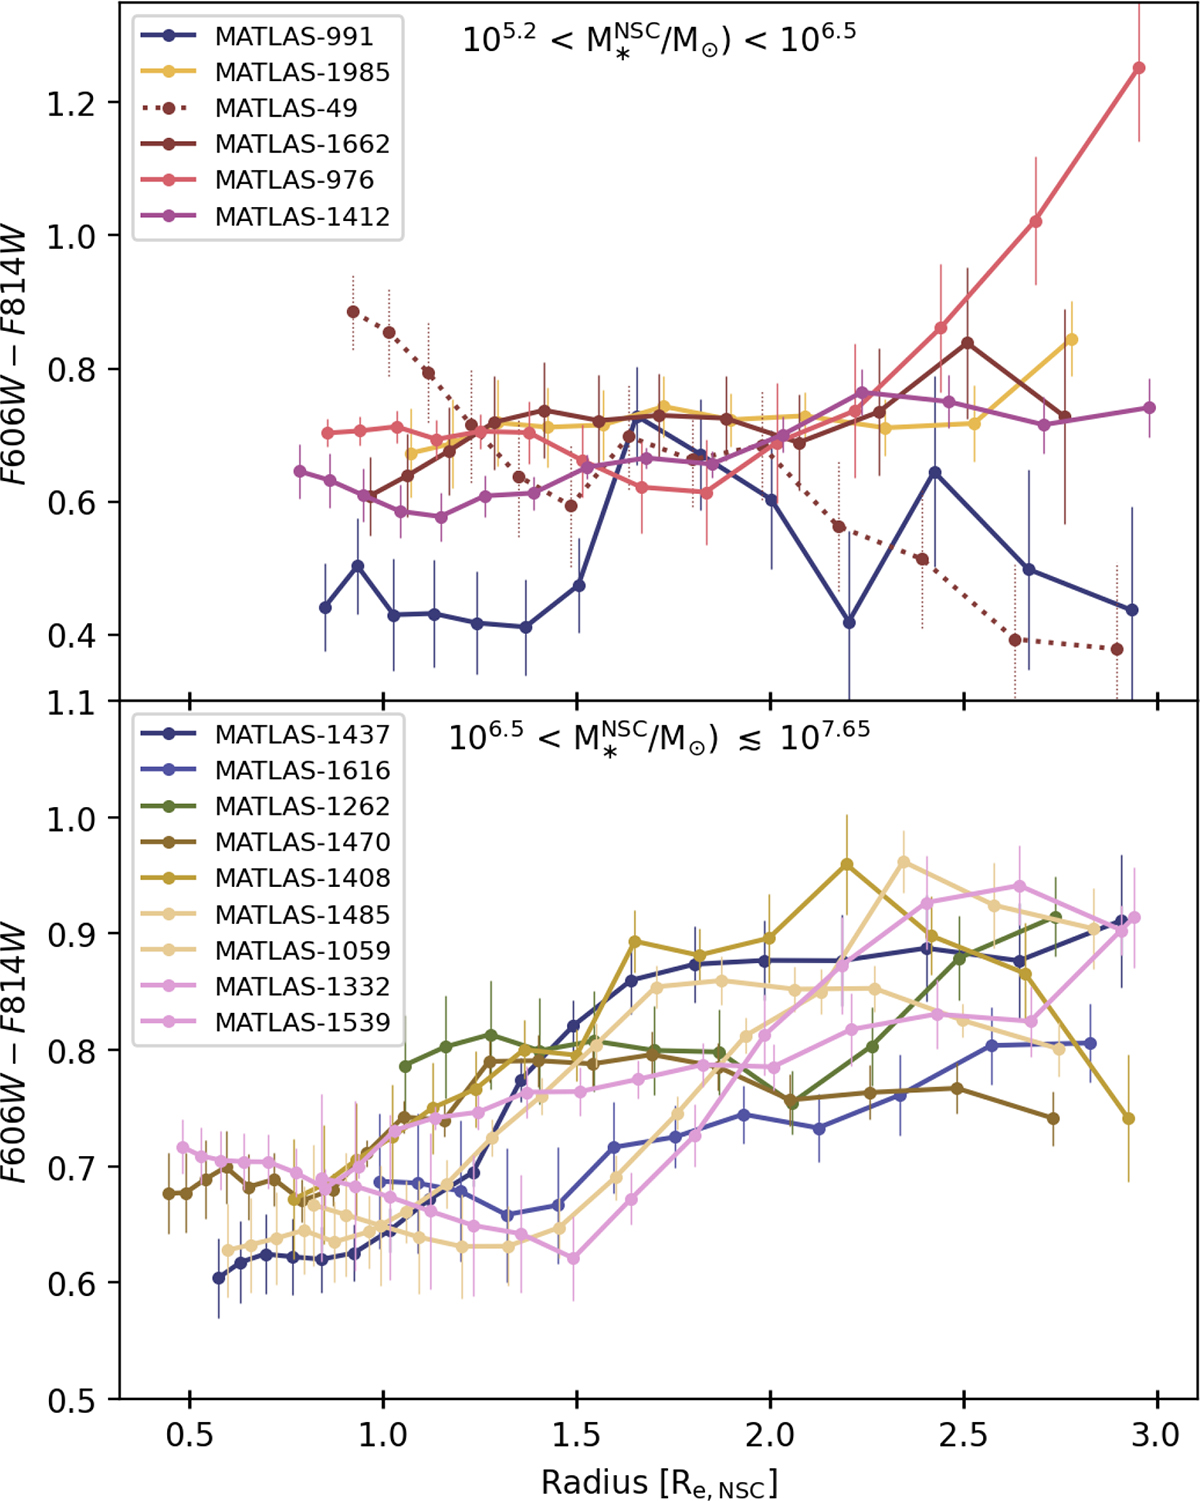
Color profiles observed within 3Re,NSC for the 15 modeled NSCs with Re,NSC > 1 pix. The NSCs are order by increasing M![]() and split into two subplots: M
and split into two subplots: M![]() M⊙ (top) mostly showing constant profiles, and M
M⊙ (top) mostly showing constant profiles, and M![]() M⊙ (center) with varying profiles from redder outskirts to a bluer center. The peculiar profile, from bluer outskirts to an inner redder color, of MATLAS-49 is highlighted with a dotted line.
M⊙ (center) with varying profiles from redder outskirts to a bluer center. The peculiar profile, from bluer outskirts to an inner redder color, of MATLAS-49 is highlighted with a dotted line.
Current usage metrics show cumulative count of Article Views (full-text article views including HTML views, PDF and ePub downloads, according to the available data) and Abstracts Views on Vision4Press platform.
Data correspond to usage on the plateform after 2015. The current usage metrics is available 48-96 hours after online publication and is updated daily on week days.
Initial download of the metrics may take a while.