Open Access
Fig. 6.
Download original image
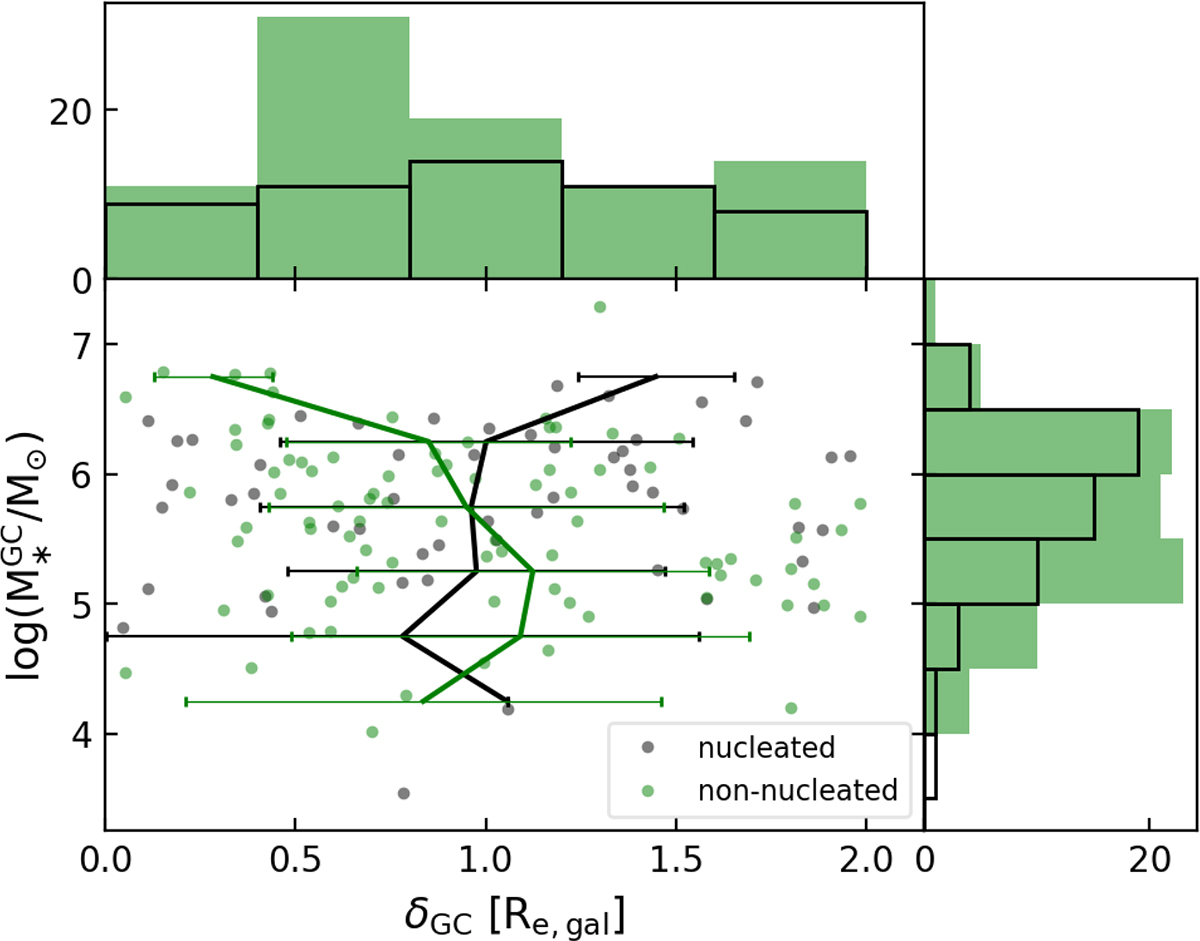
M![]() as a function of the radial distribution of the GCs for the nucleated (black) and non-nucleated (green) dwarfs. We show the running average of the radial distance δGC per bin 0.5 log(M
as a function of the radial distribution of the GCs for the nucleated (black) and non-nucleated (green) dwarfs. We show the running average of the radial distance δGC per bin 0.5 log(M![]() /M⊙) with lines. The error bars represent the standard deviation.
/M⊙) with lines. The error bars represent the standard deviation.
Current usage metrics show cumulative count of Article Views (full-text article views including HTML views, PDF and ePub downloads, according to the available data) and Abstracts Views on Vision4Press platform.
Data correspond to usage on the plateform after 2015. The current usage metrics is available 48-96 hours after online publication and is updated daily on week days.
Initial download of the metrics may take a while.