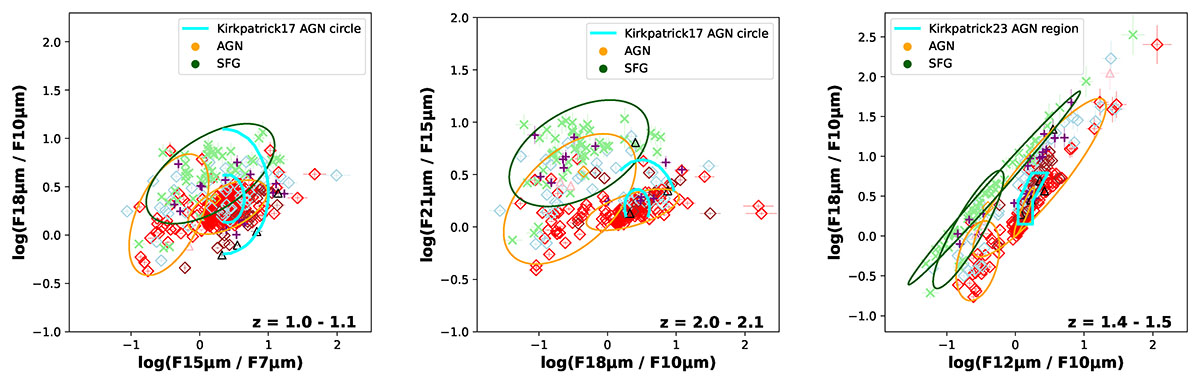
Fig. 3.
Download original image
Left and middle panels: Color–color diagrams adopted from Kirkpatrick et al. 2017. The solid cyan circles are their AGN, composite, and SFGs regions. Right panel: Color–color diagram Kirkpatrick et al. 2023. The cyan hexagon defines their AGN region. In all panels, the dark green and orange ellipses respectively represent the SFGs and AGN regions obtained by the GMM analysis.
Current usage metrics show cumulative count of Article Views (full-text article views including HTML views, PDF and ePub downloads, according to the available data) and Abstracts Views on Vision4Press platform.
Data correspond to usage on the plateform after 2015. The current usage metrics is available 48-96 hours after online publication and is updated daily on week days.
Initial download of the metrics may take a while.