Fig. 6.
Download original image
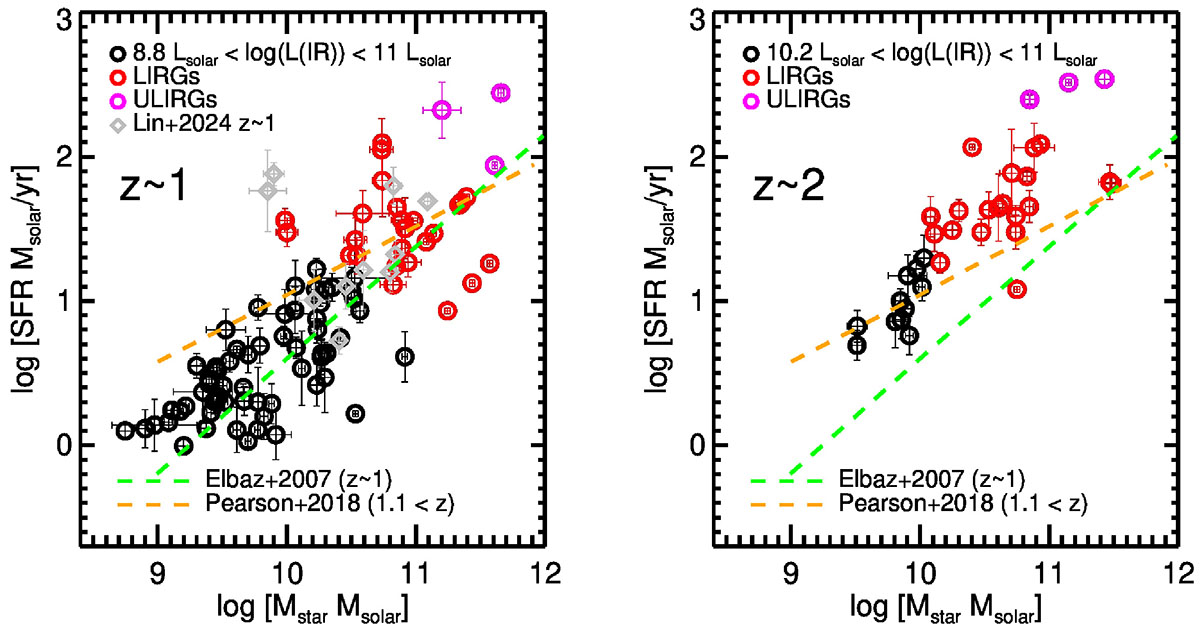
Left panel: Distribution of our z ∼ 1 MIRI-selected SFGs over the SFR–M⊙ correlation at z ∼ 1. The SFR and Mstar are obtained from the SED analysis. The green dashed line is z = 0.8 − 1.2 MS relation of Elbaz et al. 2007. The orange dashed line is z = 1.1 − 1.4 the MS relation from Pearson et al. 2018. The gray diamonds are the MIRI-selected SFGs sample of Lin et al. 2024. The majority of our z ∼ 1 sample is consistent with the MS relation of Elbaz et al. 2007. Right panel: Distribution of our MIRI-selected SFGs at z ∼ 2 over the SFR–M⊙ correlation at z ∼ 1. The distribution of the z ∼ 2 SFGs indicates an evolution compared to z ∼ 1 MS.
Current usage metrics show cumulative count of Article Views (full-text article views including HTML views, PDF and ePub downloads, according to the available data) and Abstracts Views on Vision4Press platform.
Data correspond to usage on the plateform after 2015. The current usage metrics is available 48-96 hours after online publication and is updated daily on week days.
Initial download of the metrics may take a while.