Fig. 11
Download original image
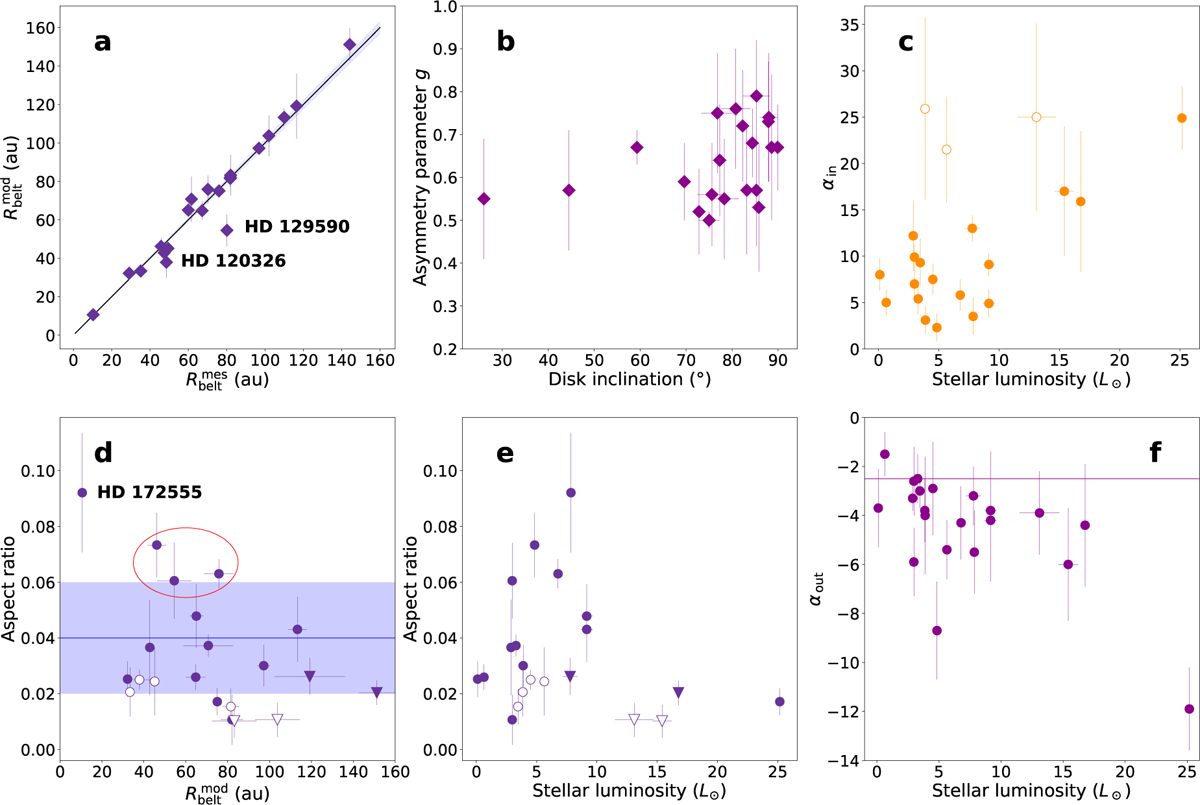
Best-fit parameters for the debris disks listed in Table G.1. Panel a: comparison of the measured (![]() ) and modeled (
) and modeled (![]() ) radial distances of the planetesimal belts. The empirical fit is shown by the black solid line, which coincides with the 1:1 relation. The blue-shaded area represents the uncertainty on the slope of the fit. Panel b: HG asymmetry parameter g versus disk inclination. Panel c: exponent of the inner radial power law αin as a function of stellar luminosity. Open circles show the exponents obtained by modeling the total intensity images of the HD 114082, HD 117214 and HD 131488 disks. Panel d: disk aspect ratio versus radius of the planetesimal belt. Debris disks with unresolved FWHM are marked with open symbols. Gas-rich systems are indicated by triangles. The blue solid line represents the theoretical scale height value of 0.04 for a collisionally excited debris disk, while the blue-shaded area indicates its associated uncertainty (Thebault 2009). The red ellipse encloses targets HD 106906, HD 115600 and HD 129590. Panel e: disk aspect ratio versus stellar luminosity. Marker symbols are the same as in panel d. Panel f: exponent of the outer radial power law αout as a function of stellar luminosity. The solid horizontal line indicates the value αout = −2.5, as theoretically predicted for the outer regions of debris disks (Strubbe & Chiang 2006; Thebault et al. 2023).
) radial distances of the planetesimal belts. The empirical fit is shown by the black solid line, which coincides with the 1:1 relation. The blue-shaded area represents the uncertainty on the slope of the fit. Panel b: HG asymmetry parameter g versus disk inclination. Panel c: exponent of the inner radial power law αin as a function of stellar luminosity. Open circles show the exponents obtained by modeling the total intensity images of the HD 114082, HD 117214 and HD 131488 disks. Panel d: disk aspect ratio versus radius of the planetesimal belt. Debris disks with unresolved FWHM are marked with open symbols. Gas-rich systems are indicated by triangles. The blue solid line represents the theoretical scale height value of 0.04 for a collisionally excited debris disk, while the blue-shaded area indicates its associated uncertainty (Thebault 2009). The red ellipse encloses targets HD 106906, HD 115600 and HD 129590. Panel e: disk aspect ratio versus stellar luminosity. Marker symbols are the same as in panel d. Panel f: exponent of the outer radial power law αout as a function of stellar luminosity. The solid horizontal line indicates the value αout = −2.5, as theoretically predicted for the outer regions of debris disks (Strubbe & Chiang 2006; Thebault et al. 2023).
Current usage metrics show cumulative count of Article Views (full-text article views including HTML views, PDF and ePub downloads, according to the available data) and Abstracts Views on Vision4Press platform.
Data correspond to usage on the plateform after 2015. The current usage metrics is available 48-96 hours after online publication and is updated daily on week days.
Initial download of the metrics may take a while.