Fig. 12
Download original image
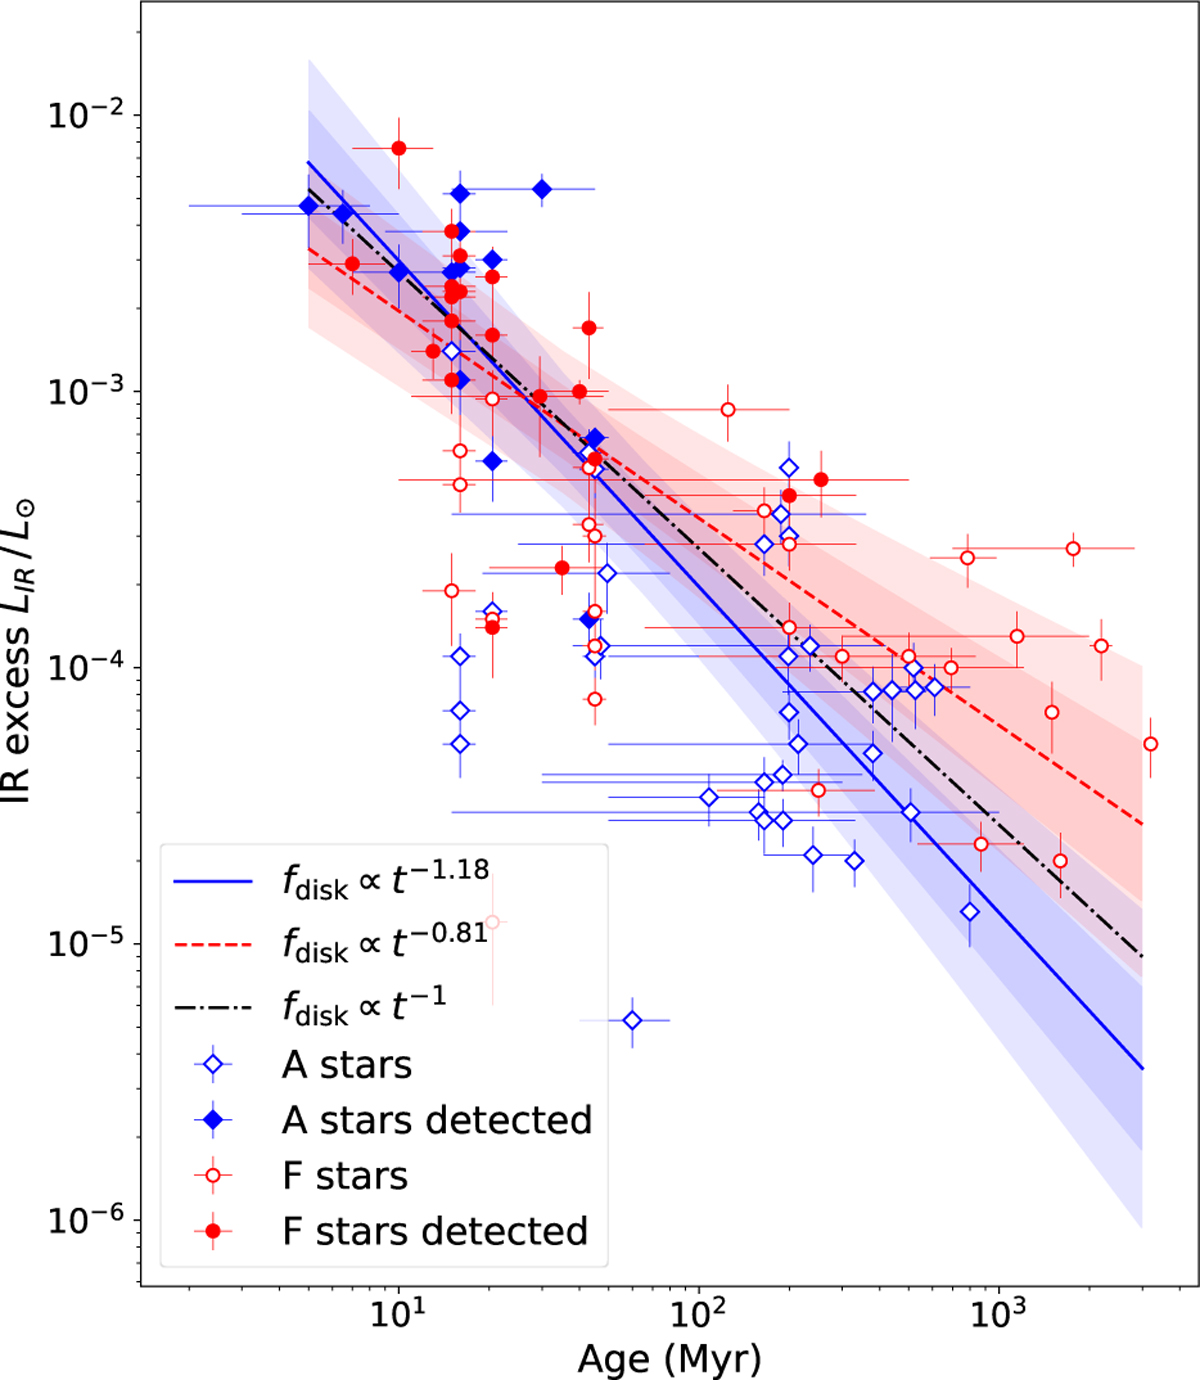
Evolution of the IR excesses (fdisk) for A- and F-type stars in our sample. Targets with debris disks detected using SPHERE instruments are shown as filled circles. The blue solid line represents a fit to the A-type star sub-sample, the red dashed line to the F-type star subsample, and the black dash-dotted line indicates the expected decline of IR excess for debris disks evolving in a steady-state collisional regime. The blue- and red-shaded regions indicate the 68% and 95% confidence bands for the fits to the A-type and F-type star subsamples, respectively.
Current usage metrics show cumulative count of Article Views (full-text article views including HTML views, PDF and ePub downloads, according to the available data) and Abstracts Views on Vision4Press platform.
Data correspond to usage on the plateform after 2015. The current usage metrics is available 48-96 hours after online publication and is updated daily on week days.
Initial download of the metrics may take a while.