Fig. 24
Download original image
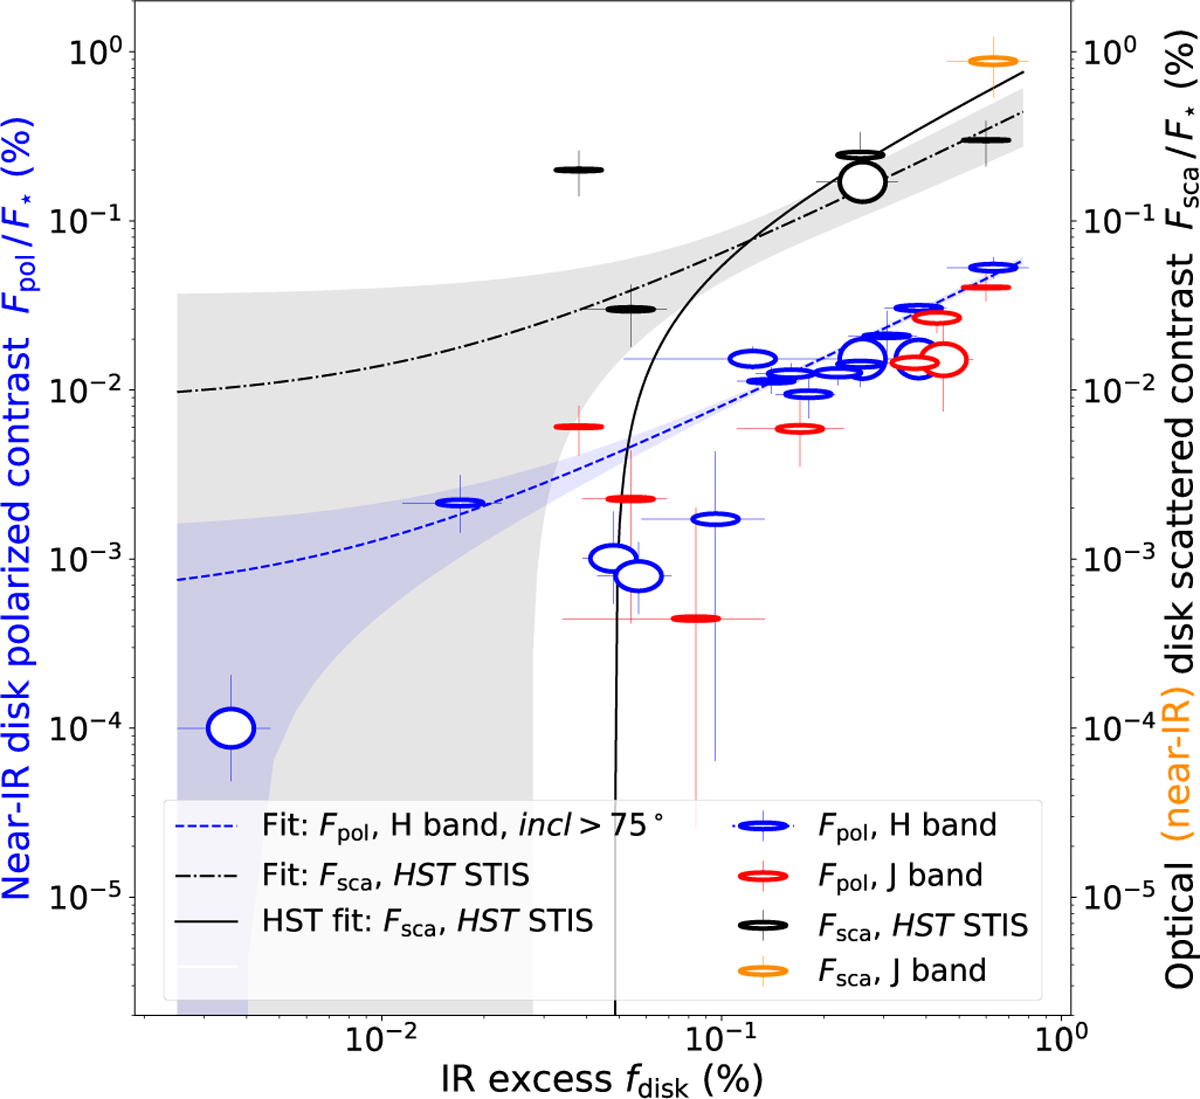
Polarized disk contrast in the near-IR measured with SPHERE/IRDIS in the broadband H (blue markers) and J (red markers) filters, and total scattered-light contrast in the optical measured with HST/STIS (black markers) plotted against the disk fractional IR luminosity. The orange marker represents the scattered-light contrast for HD 129590 measured in the H band with IRDIS. The axis ratio of each elliptical marker corresponds to the ratio of the minor to major axis of the respective disk, representing its inclination. The black dash-dotted line shows a linear fit to the optical total scattered-light contrast measured with HST/STIS for five debris disks (Sect. 6.3.7). The gray-shaded region indicates the 68% confidence interval for the fit. The black solid line shows the fit to the optical total scattered-light contrast obtained by Schneider et al. (2014) for a set of ten debris disks. The blue dashed line denotes a linear fit to the H-band polarized contrast for disks with inclinations higher than 75°, while the blue-shaded region indicates the 68% confidence interval for this fit.
Current usage metrics show cumulative count of Article Views (full-text article views including HTML views, PDF and ePub downloads, according to the available data) and Abstracts Views on Vision4Press platform.
Data correspond to usage on the plateform after 2015. The current usage metrics is available 48-96 hours after online publication and is updated daily on week days.
Initial download of the metrics may take a while.