Fig. 25
Download original image
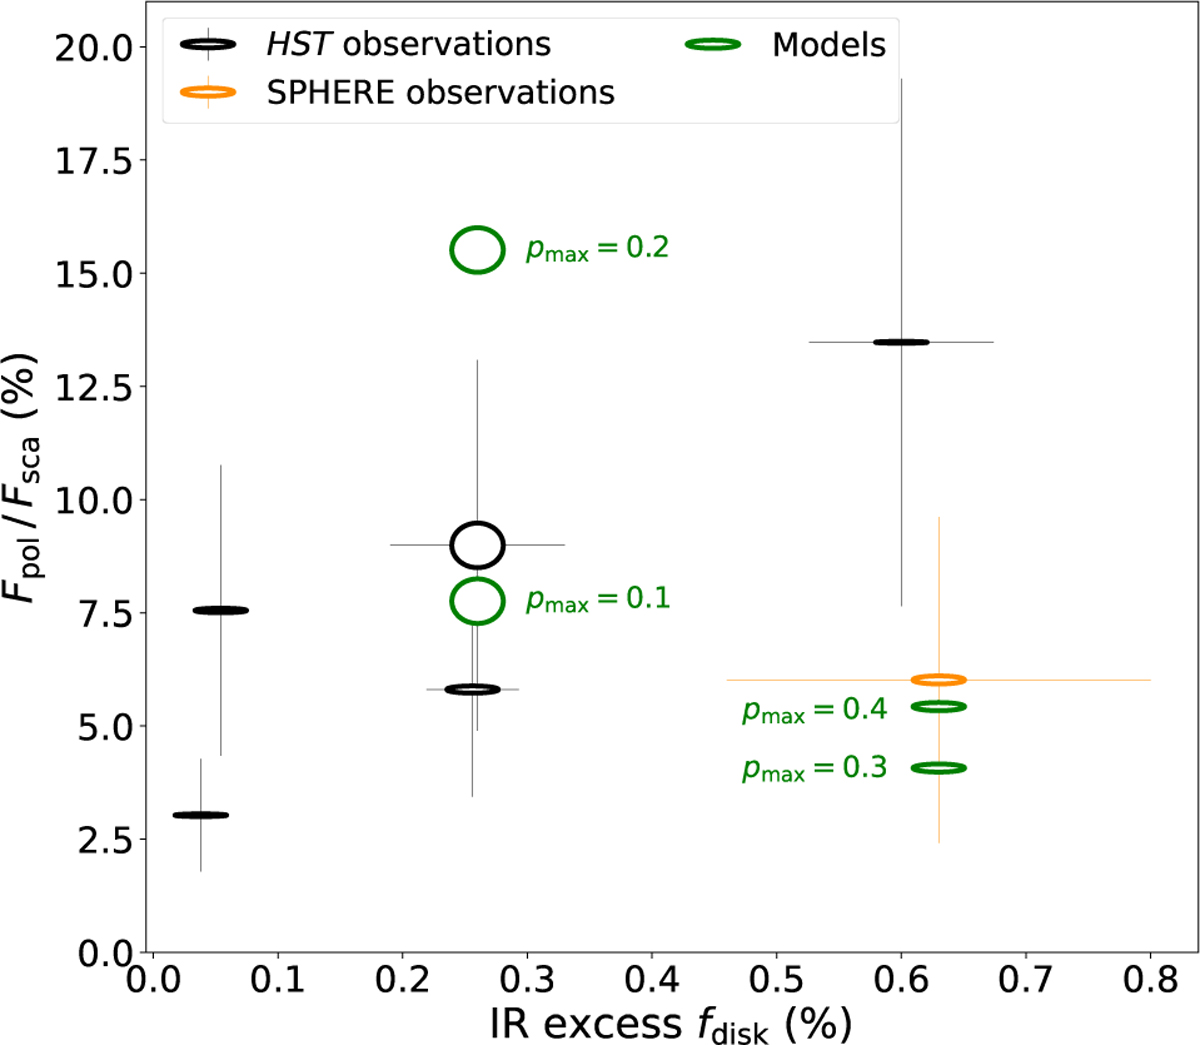
Ratio of polarized and scattered flux as a function of disk IR excess for debris disks observed with HST/STIS (black markers) and for the HD 129590 disk measured with SPHERE/IRDIS in the H band (orange marker). Green markers indicate model-predicted positions for a disk inclined at 30° with pmax = 0.1 and pmax = 0.2 (for comparison with HD 181327 data point), and a disk inclined at 80° with g = 0.7 and pmax = 0.3 or pmax = 0.4 (for comparison with HD 129590 data point). The axis ratio of each elliptical marker corresponds to the ratio of the minor to major axis of the respective disk, thereby visually representing the disk inclination.
Current usage metrics show cumulative count of Article Views (full-text article views including HTML views, PDF and ePub downloads, according to the available data) and Abstracts Views on Vision4Press platform.
Data correspond to usage on the plateform after 2015. The current usage metrics is available 48-96 hours after online publication and is updated daily on week days.
Initial download of the metrics may take a while.