Fig. 7
Download original image
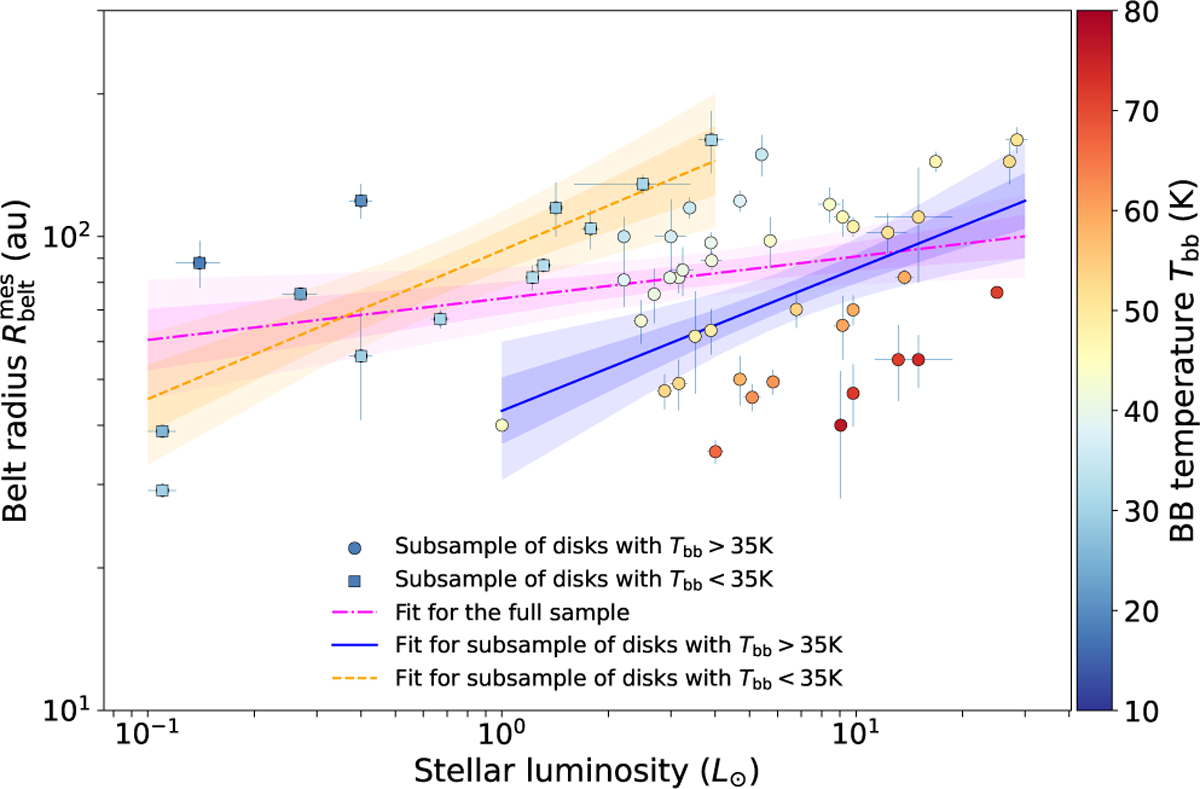
Belt radii measured from r2−scaled scattered-light images as a function of stellar luminosity. The magenta line represents the best-fit power-law relation for the full sample of resolved debris belts. The orange and blue lines show the fits for subsamples with BB dust temperatures below and above 35 K, respectively. The magenta-, orange- and blue-shaded regions indicate the 68% and 95% confidence bands for the corresponding fits.
Current usage metrics show cumulative count of Article Views (full-text article views including HTML views, PDF and ePub downloads, according to the available data) and Abstracts Views on Vision4Press platform.
Data correspond to usage on the plateform after 2015. The current usage metrics is available 48-96 hours after online publication and is updated daily on week days.
Initial download of the metrics may take a while.