Fig. 8
Download original image
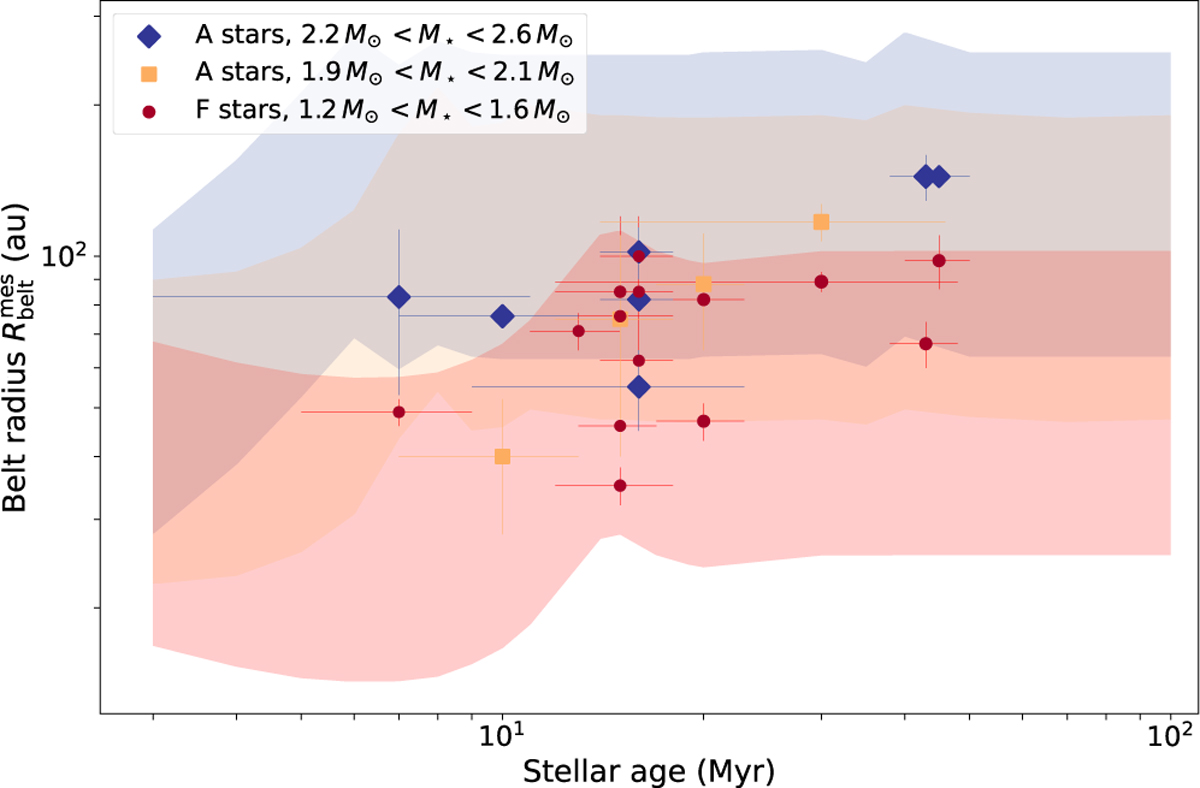
Belt radii measured from r2−scaled scattered-light images plotted as a function of stellar age for targets in the CO2 subsample. Red, yellow and blue shaded regions indicate the temporal evolution of the CO2 freeze-out zones for stars with masses of 1.5, 2 and 2.3 M⊙, respectively. The upper and lower boundaries of the freeze-out zones correspond to the BB temperature of 40 and 80 K, respectively. The orange and gray shaded regions are the results of the overlap of the three regions.
Current usage metrics show cumulative count of Article Views (full-text article views including HTML views, PDF and ePub downloads, according to the available data) and Abstracts Views on Vision4Press platform.
Data correspond to usage on the plateform after 2015. The current usage metrics is available 48-96 hours after online publication and is updated daily on week days.
Initial download of the metrics may take a while.