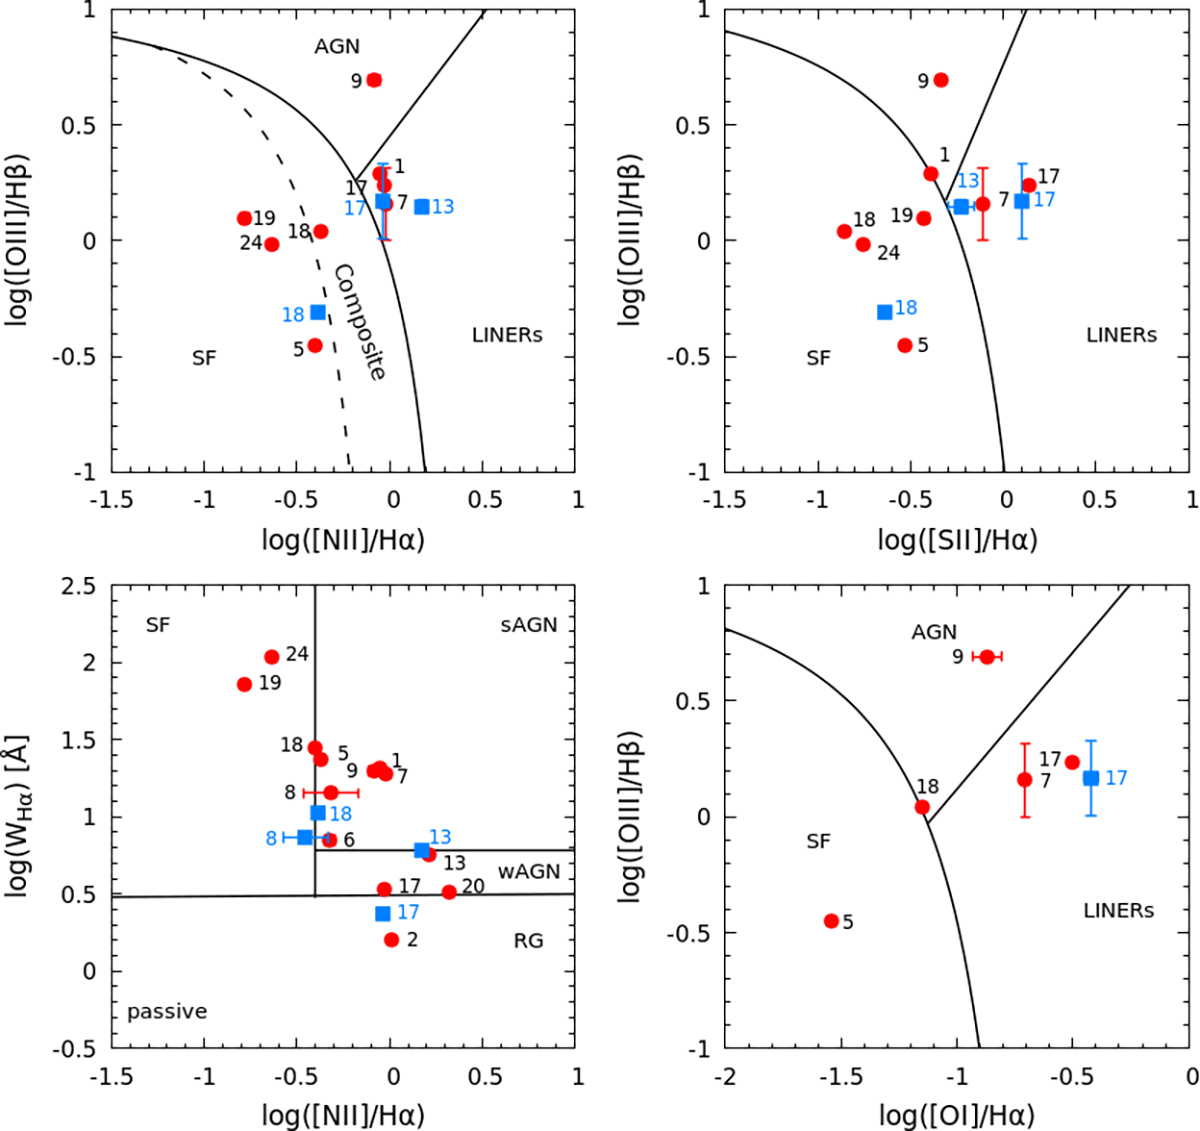
Fig. 2.
Download original image
Emission-line diagnostic diagrams: [O III]λ5007/Hβ versus three different line ratios (BPT; Baldwin et al. 1981; Kewley et al. 2001, 2006; Kauffmann et al. 2003) and WHα versus [N II]λ6584/Hα (WHAN; Cid Fernandes et al. 2011). The lines demarcate boundaries between sources classified as star-forming (SF) galaxies, AGNs, low-ionization nuclear emission-line regions (LINERs), “Composite” sources, weak AGNs (wAGN), strong AGNs (sAGN), retired galaxies (RG) and passive galaxies. Classifications based on SDSS observations are indicated by blue squares, while red circles indicate the classifications based on Palomar and Keck observations. Numbers refer to source identifications in Table 1.
Current usage metrics show cumulative count of Article Views (full-text article views including HTML views, PDF and ePub downloads, according to the available data) and Abstracts Views on Vision4Press platform.
Data correspond to usage on the plateform after 2015. The current usage metrics is available 48-96 hours after online publication and is updated daily on week days.
Initial download of the metrics may take a while.