Fig. 3.
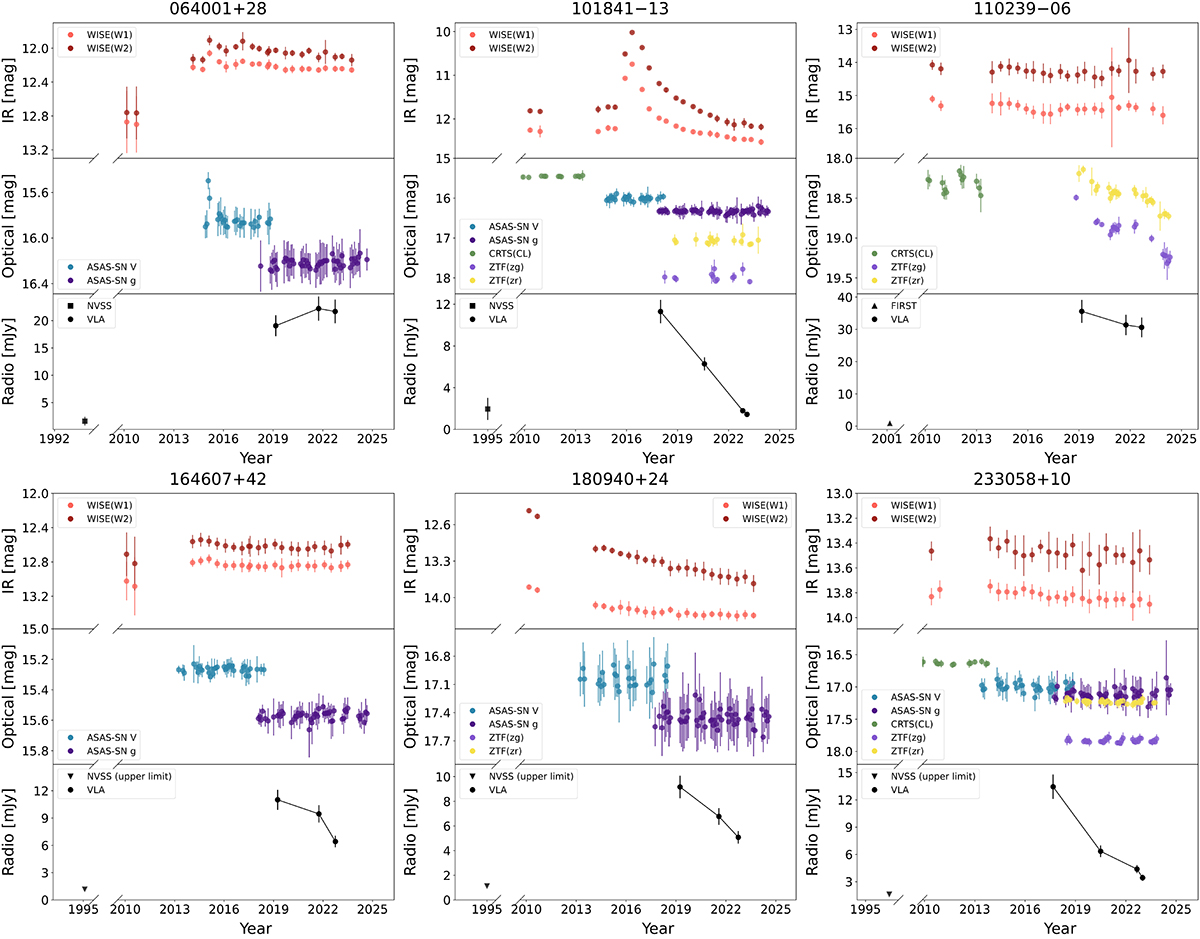
Download original image
Light curves in the optical, infrared, and radio (3 GHz) for selected objects. In case of optical and infrared curves the individual points represent monthly averaged values after 3σ clipping to reject outliers. For radio observations (NVSS, FIRST, VLA), the points correspond to single measurements. The VLA data come from the VLASS survey as well as dedicated observations, as reported in Kunert-Bajraszewska et al. (2025).
Current usage metrics show cumulative count of Article Views (full-text article views including HTML views, PDF and ePub downloads, according to the available data) and Abstracts Views on Vision4Press platform.
Data correspond to usage on the plateform after 2015. The current usage metrics is available 48-96 hours after online publication and is updated daily on week days.
Initial download of the metrics may take a while.