Fig. 4.
Download original image
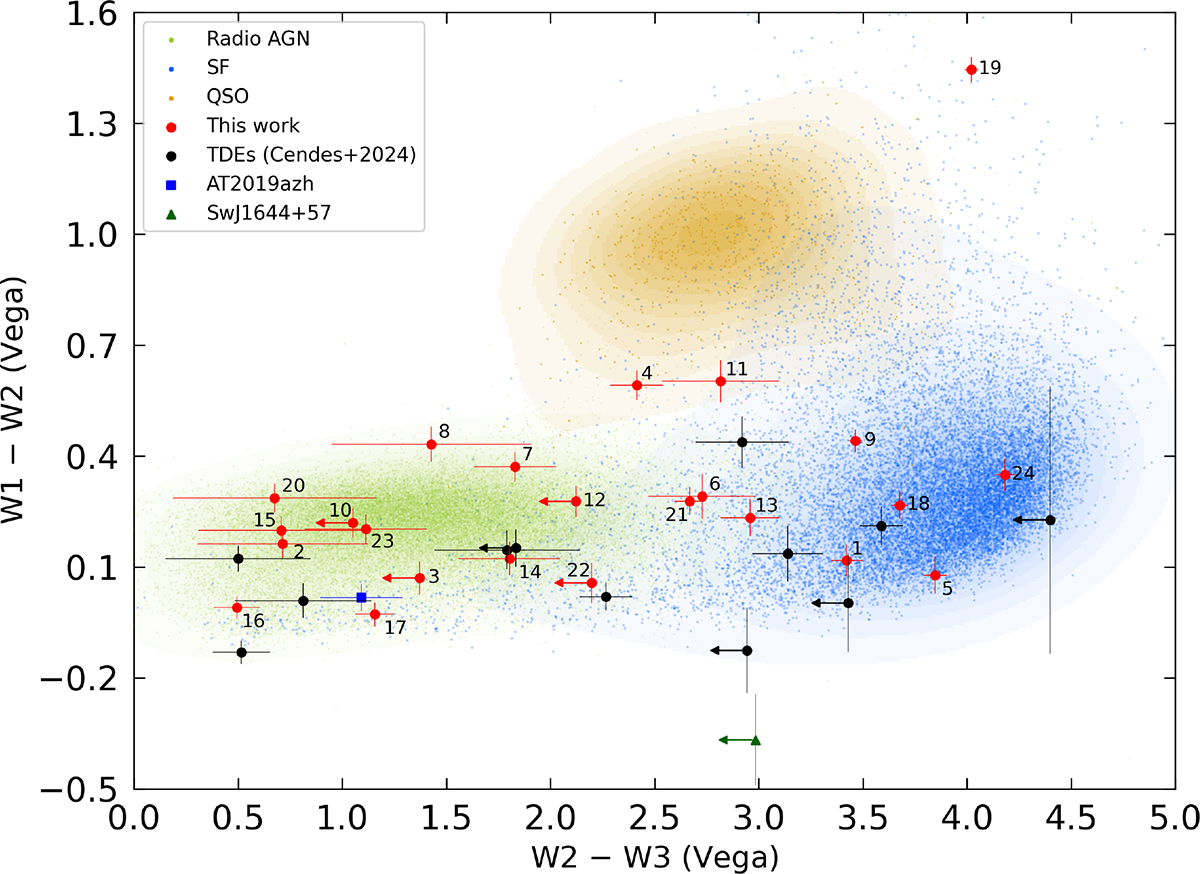
WISE color–color plot for sources presented in this work (red dots). Numbers refer to source identifications in Table 1. Additional points (black dots, blue square, and green triangle) represent optically discovered TDEs as described in the text. The colored density clouds represent the following objects: radio galaxies (green dots), star-forming galaxies (blue dots), and quasars (yellow dots). These data come from the ROGUE I (Kozieł-Wierzbowska et al. 2021) and ROGUE II (Kozieł-Wierzbowska, in prep.) catalogs.
Current usage metrics show cumulative count of Article Views (full-text article views including HTML views, PDF and ePub downloads, according to the available data) and Abstracts Views on Vision4Press platform.
Data correspond to usage on the plateform after 2015. The current usage metrics is available 48-96 hours after online publication and is updated daily on week days.
Initial download of the metrics may take a while.