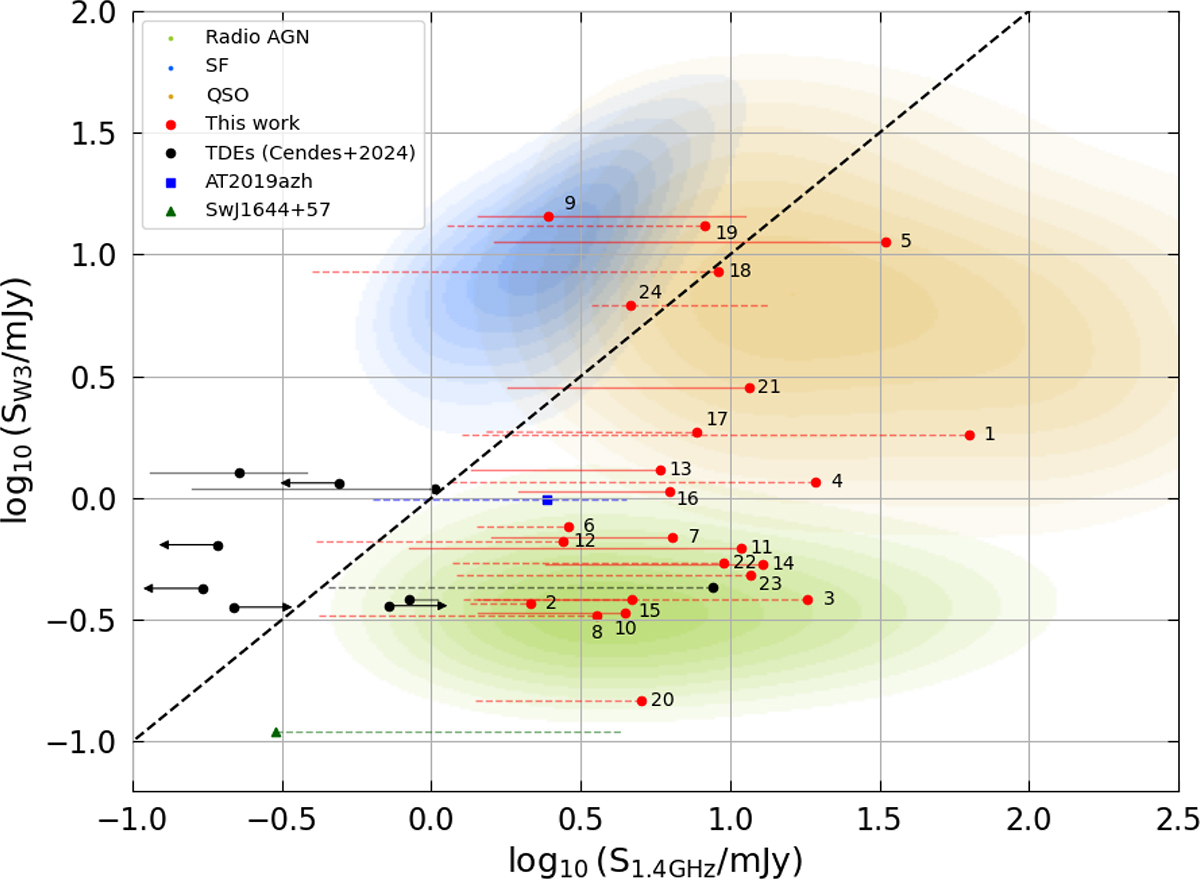
Fig. 5.
Download original image
Mid-infrared (W3) versus radio (1.4 GHz) flux density diagram for the sources presented in this work (red dots). Source numbers correspond to the identifications listed in Table 1. Additional points–black dots, the blue square, and the green triangle–represent optically discovered TDEs. For clarity, error bars and upper limits are not shown in this figure. The solid and dashed lines indicate the evolution of radio flux density for individual sources, as described in detail in the text. To improve the readability of the plot, the main populations of objects are represented only by the contours of their density distributions: radio galaxies (green), star-forming galaxies (blue), and quasars (yellow). These reference data are taken from the ROGUE I (Kozieł-Wierzbowska et al. 2021) and ROGUE II (Kozieł-Wierzbowska, in prep.) catalogs. The main dashed line marks the relation SW3 = S1.4 GHz, which serves to separate radio galaxies from star-forming galaxies based on the ROGUE I sample.
Current usage metrics show cumulative count of Article Views (full-text article views including HTML views, PDF and ePub downloads, according to the available data) and Abstracts Views on Vision4Press platform.
Data correspond to usage on the plateform after 2015. The current usage metrics is available 48-96 hours after online publication and is updated daily on week days.
Initial download of the metrics may take a while.