Fig. 11.
Download original image
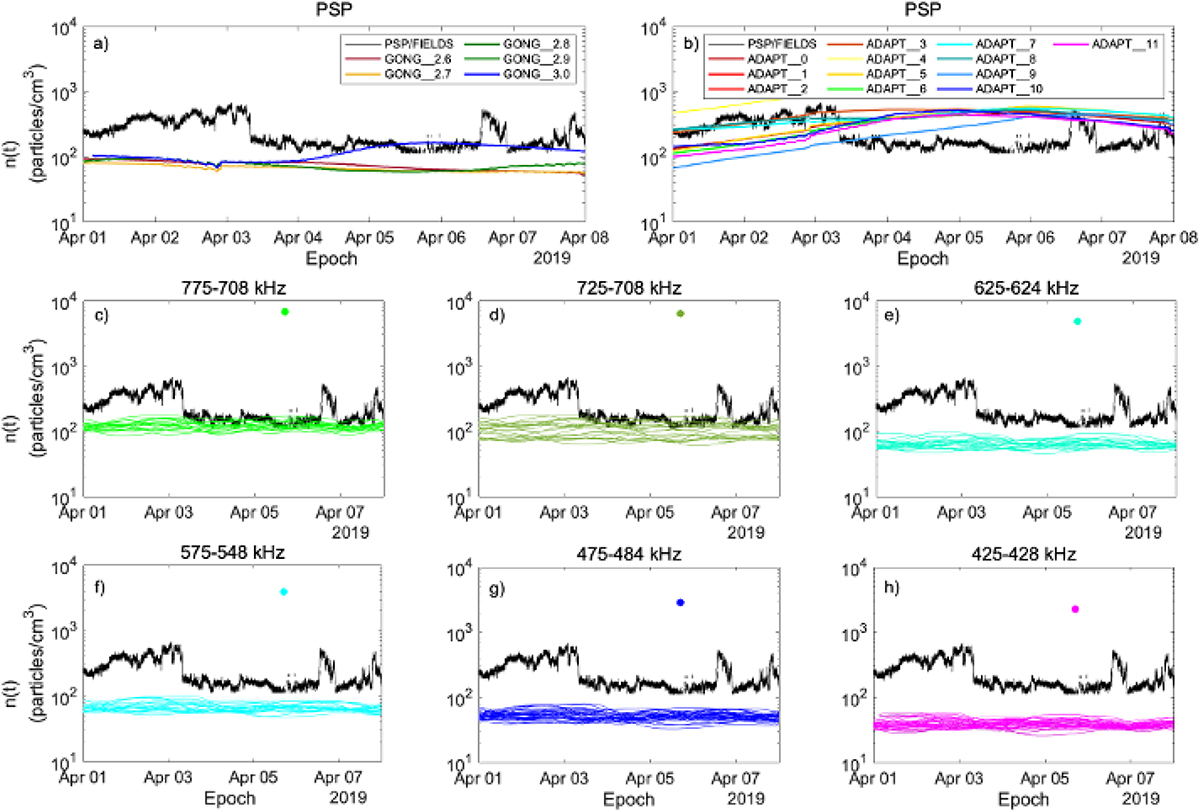
Comparison of PSP/FIELDS in situ electron density (black line) with EUHFORIA simulation results at various positions in the heliosphere. Panel (a) displays simulations at PSP position using GONG magnetograms, with different colored lines representing simulations performed with varying SSRs. The simulation using SSR = 3 R⊙ shows the best agreement with the in situ data. Panel (b) shows simulations using default PFSS height at PSP position using all realizations of ADAPT magnetic maps, which in this case provide a better match than those using GONG magnetograms. Panels (c) to (h) present EUHFORIA time series obtained using ADPAT maps at radio source positions for different triangulation frequency pairs, with colored points indicating the electron density at the respective radio frequencies (radio density). Radio densities are notably higher than the in situ density, while the EUHFORIA results obtained at the radio source positions are underestimated.
Current usage metrics show cumulative count of Article Views (full-text article views including HTML views, PDF and ePub downloads, according to the available data) and Abstracts Views on Vision4Press platform.
Data correspond to usage on the plateform after 2015. The current usage metrics is available 48-96 hours after online publication and is updated daily on week days.
Initial download of the metrics may take a while.