Fig. 12.
Download original image
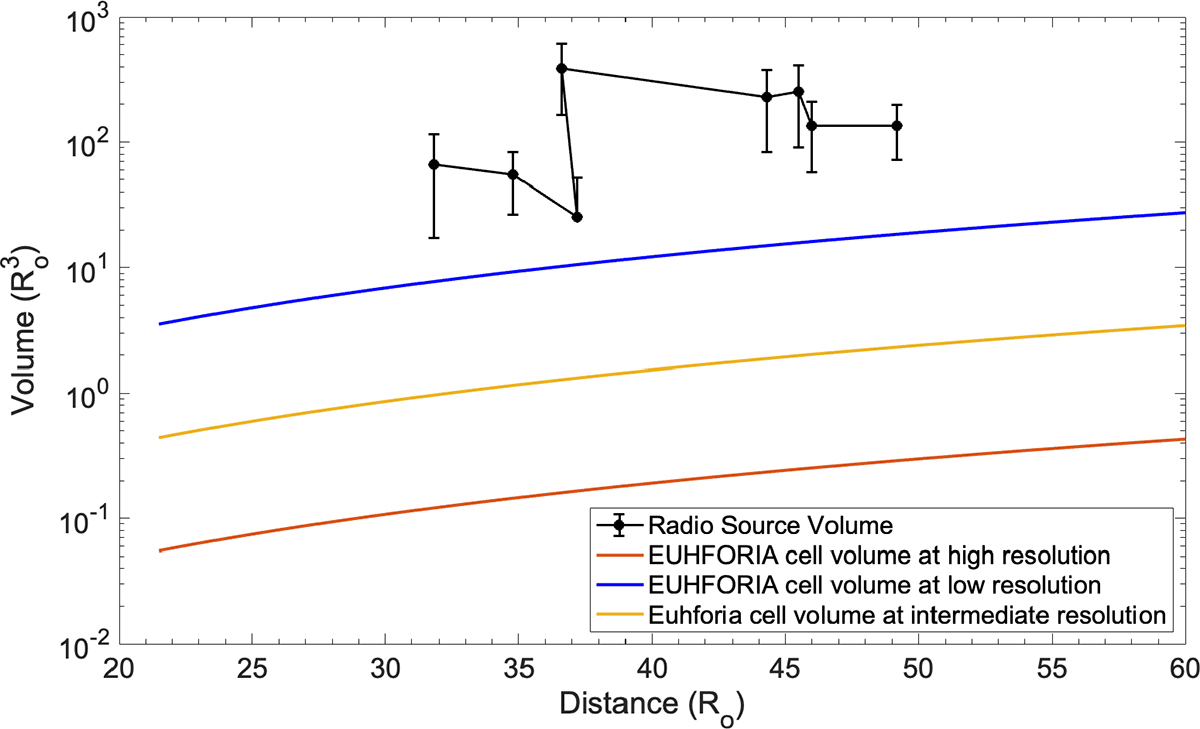
Variation of EUHFORIA cells volumes and radio source volume (black line) as a function of their distance from the Sun. The radio source volume points are estimated assuming spherical shape sources, with the distance between the wave vectors being sphere diameter. The blue, yellow, and red lines represent EUHFORIA cell volumes at low, intermediate, and high resolutions, respectively. The EUHFORIA cell volumes are notably smaller compared to the radio source volumes and therefore, can effectively model the regions occupied by the radio sources.
Current usage metrics show cumulative count of Article Views (full-text article views including HTML views, PDF and ePub downloads, according to the available data) and Abstracts Views on Vision4Press platform.
Data correspond to usage on the plateform after 2015. The current usage metrics is available 48-96 hours after online publication and is updated daily on week days.
Initial download of the metrics may take a while.