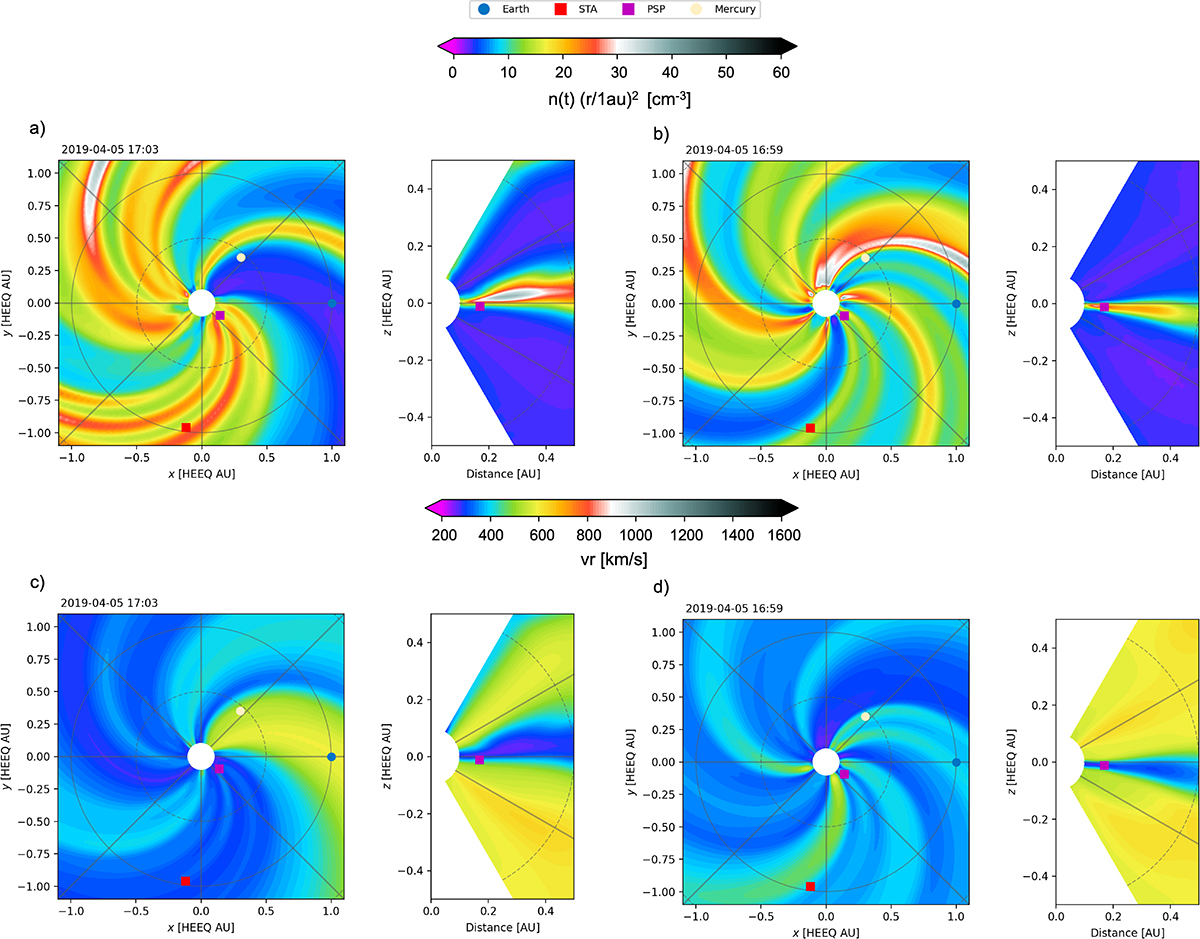
Fig. 15.
Download original image
Equatorial and meridional slice of the EUHFORIA simulation domain. The meridional plane contains PSP. In each panel, the left plot depicts the equatorial plane of the heliospheric domain, while the right plot shows the meridional view of the same domain. Panels (a) and (c) display 2D density maps obtained using GONG and ADAPT magnetic maps, respectively. Panels (b) and (d) illustrate 2D velocity maps using GONG and ADAPT magnetic maps, respectively. The meridional plots highlight PSP’s trajectory through a high-density, low-velocity region in both simulations with GONG and ADAPT magnetograms.
Current usage metrics show cumulative count of Article Views (full-text article views including HTML views, PDF and ePub downloads, according to the available data) and Abstracts Views on Vision4Press platform.
Data correspond to usage on the plateform after 2015. The current usage metrics is available 48-96 hours after online publication and is updated daily on week days.
Initial download of the metrics may take a while.