Fig. 16.
Download original image
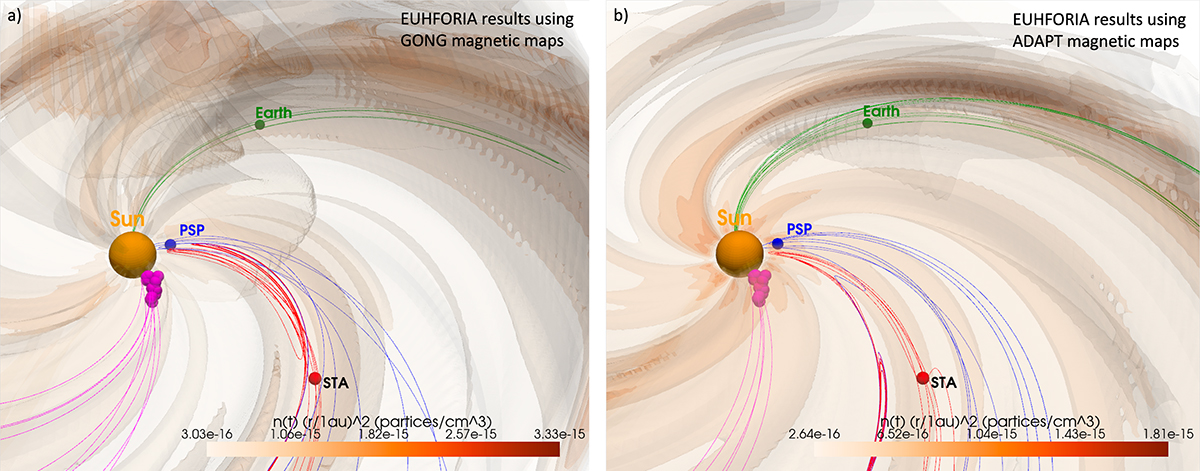
Three-dimensional Iso-surface plot of the scaled density obtained from EUHFORIA simulations. The sphere at the center represents the inner coronal boundary of EUHFORIA at 0.11 AU. Magenta spheres represent the radio source positions of Event 8. The radio sources are not plotted according to their actual sizes. Blue, red, and green spheres represent PSP, STEREO-A, and Earth positions, respectively. The magenta, red, blue, and green lines represent the magnetic field lines connecting the radio source at 775 kHz, STEREO-A, PSP, and Earth to the Sun, respectively. Panels (a) and (b) show 3D representation of the EUHFORIA density obtained using GONG and ADAPT magnetograms, respectively.
Current usage metrics show cumulative count of Article Views (full-text article views including HTML views, PDF and ePub downloads, according to the available data) and Abstracts Views on Vision4Press platform.
Data correspond to usage on the plateform after 2015. The current usage metrics is available 48-96 hours after online publication and is updated daily on week days.
Initial download of the metrics may take a while.