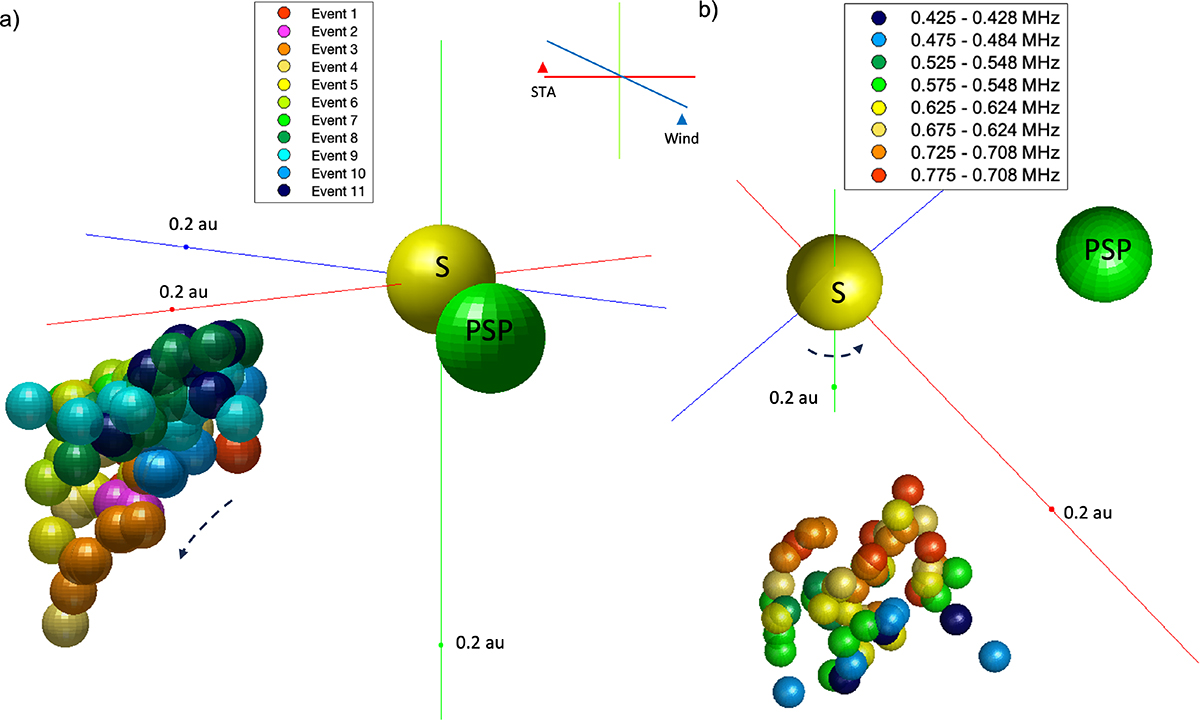
Fig. 8.
Download original image
All type III radio bursts plotted together to visualize their propagation path relative to each other. Panel (a) shows the propagation paths of all type III bursts presented in the similar viewing angle as the Events 8 and 9 (Fig. 7). The spread of the sources indicates the rotation of the associated AR. Each bursts is presented in a different color. Panel (b) shows the radio sources of all type III bursts plotted together but now also color coded by the selected frequency pairs.
Current usage metrics show cumulative count of Article Views (full-text article views including HTML views, PDF and ePub downloads, according to the available data) and Abstracts Views on Vision4Press platform.
Data correspond to usage on the plateform after 2015. The current usage metrics is available 48-96 hours after online publication and is updated daily on week days.
Initial download of the metrics may take a while.