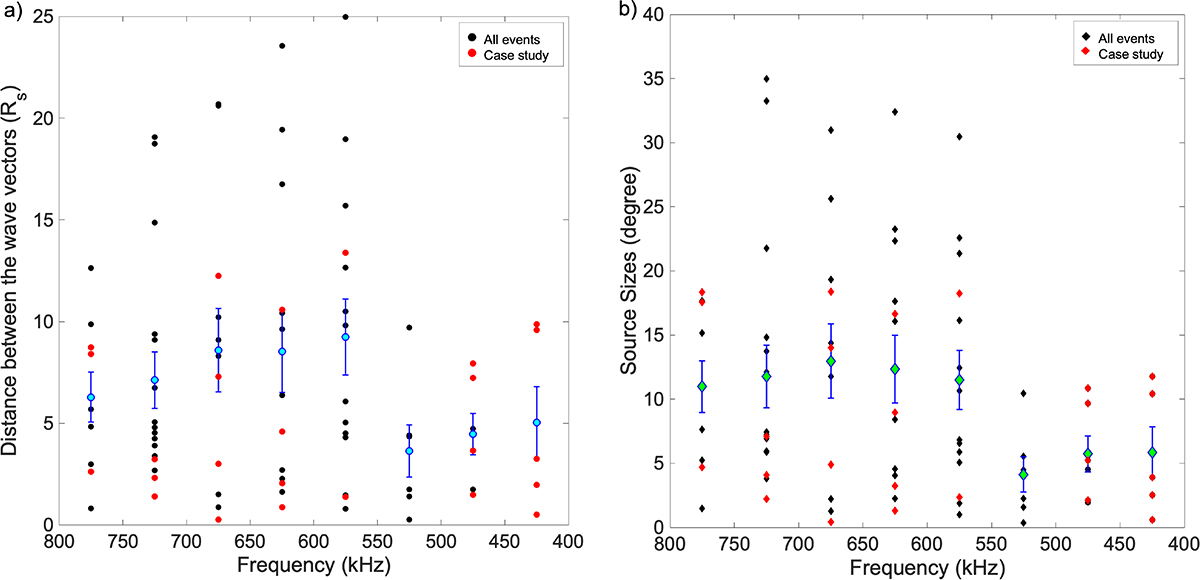
Fig. 9.
Download original image
Variation of radio source sizes with frequency for all type III radio bursts studied here. The red points represent the case study and black points shows all the selected events. The blue error bars plotted on the data represent the standard deviation estimated from bootstrapping while the cyan colored points represent the mean calculated using the bootstrapping method. Panel (a) shows the radio sources in terms of the distance between the wave vectors. The average radio source size is up to 5 R⊙, while panel (b) shows source sizes in terms of degrees.
Current usage metrics show cumulative count of Article Views (full-text article views including HTML views, PDF and ePub downloads, according to the available data) and Abstracts Views on Vision4Press platform.
Data correspond to usage on the plateform after 2015. The current usage metrics is available 48-96 hours after online publication and is updated daily on week days.
Initial download of the metrics may take a while.