Fig. A.1
Download original image
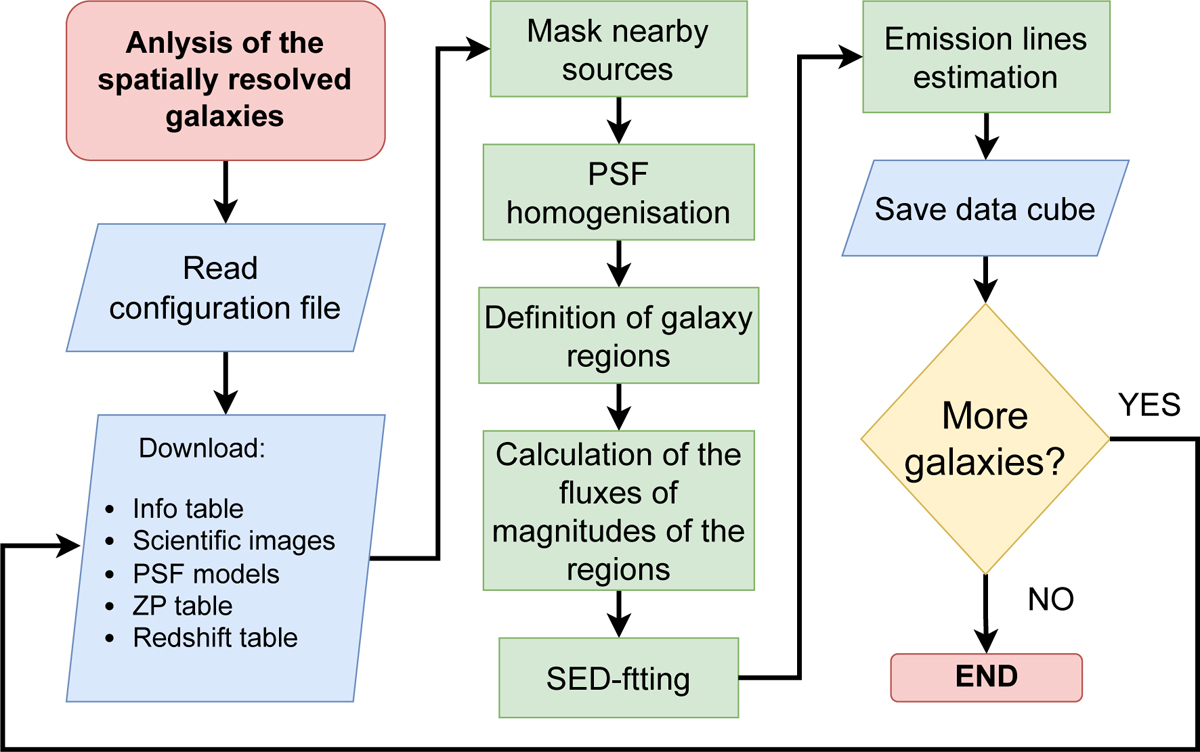
Flow diagram of Py2DJPAS. Red ovals Indicate the beginning and end of the different process, blue parallelograms indicate reading and writing input and output files, green rectangles represent computation processes and the yellow diamonds represent decision points. Further details of the processes can be found in Sects. A.1, A.2, A.3, A.4 and A.5
Current usage metrics show cumulative count of Article Views (full-text article views including HTML views, PDF and ePub downloads, according to the available data) and Abstracts Views on Vision4Press platform.
Data correspond to usage on the plateform after 2015. The current usage metrics is available 48-96 hours after online publication and is updated daily on week days.
Initial download of the metrics may take a while.