Open Access
Fig. B.2
Download original image
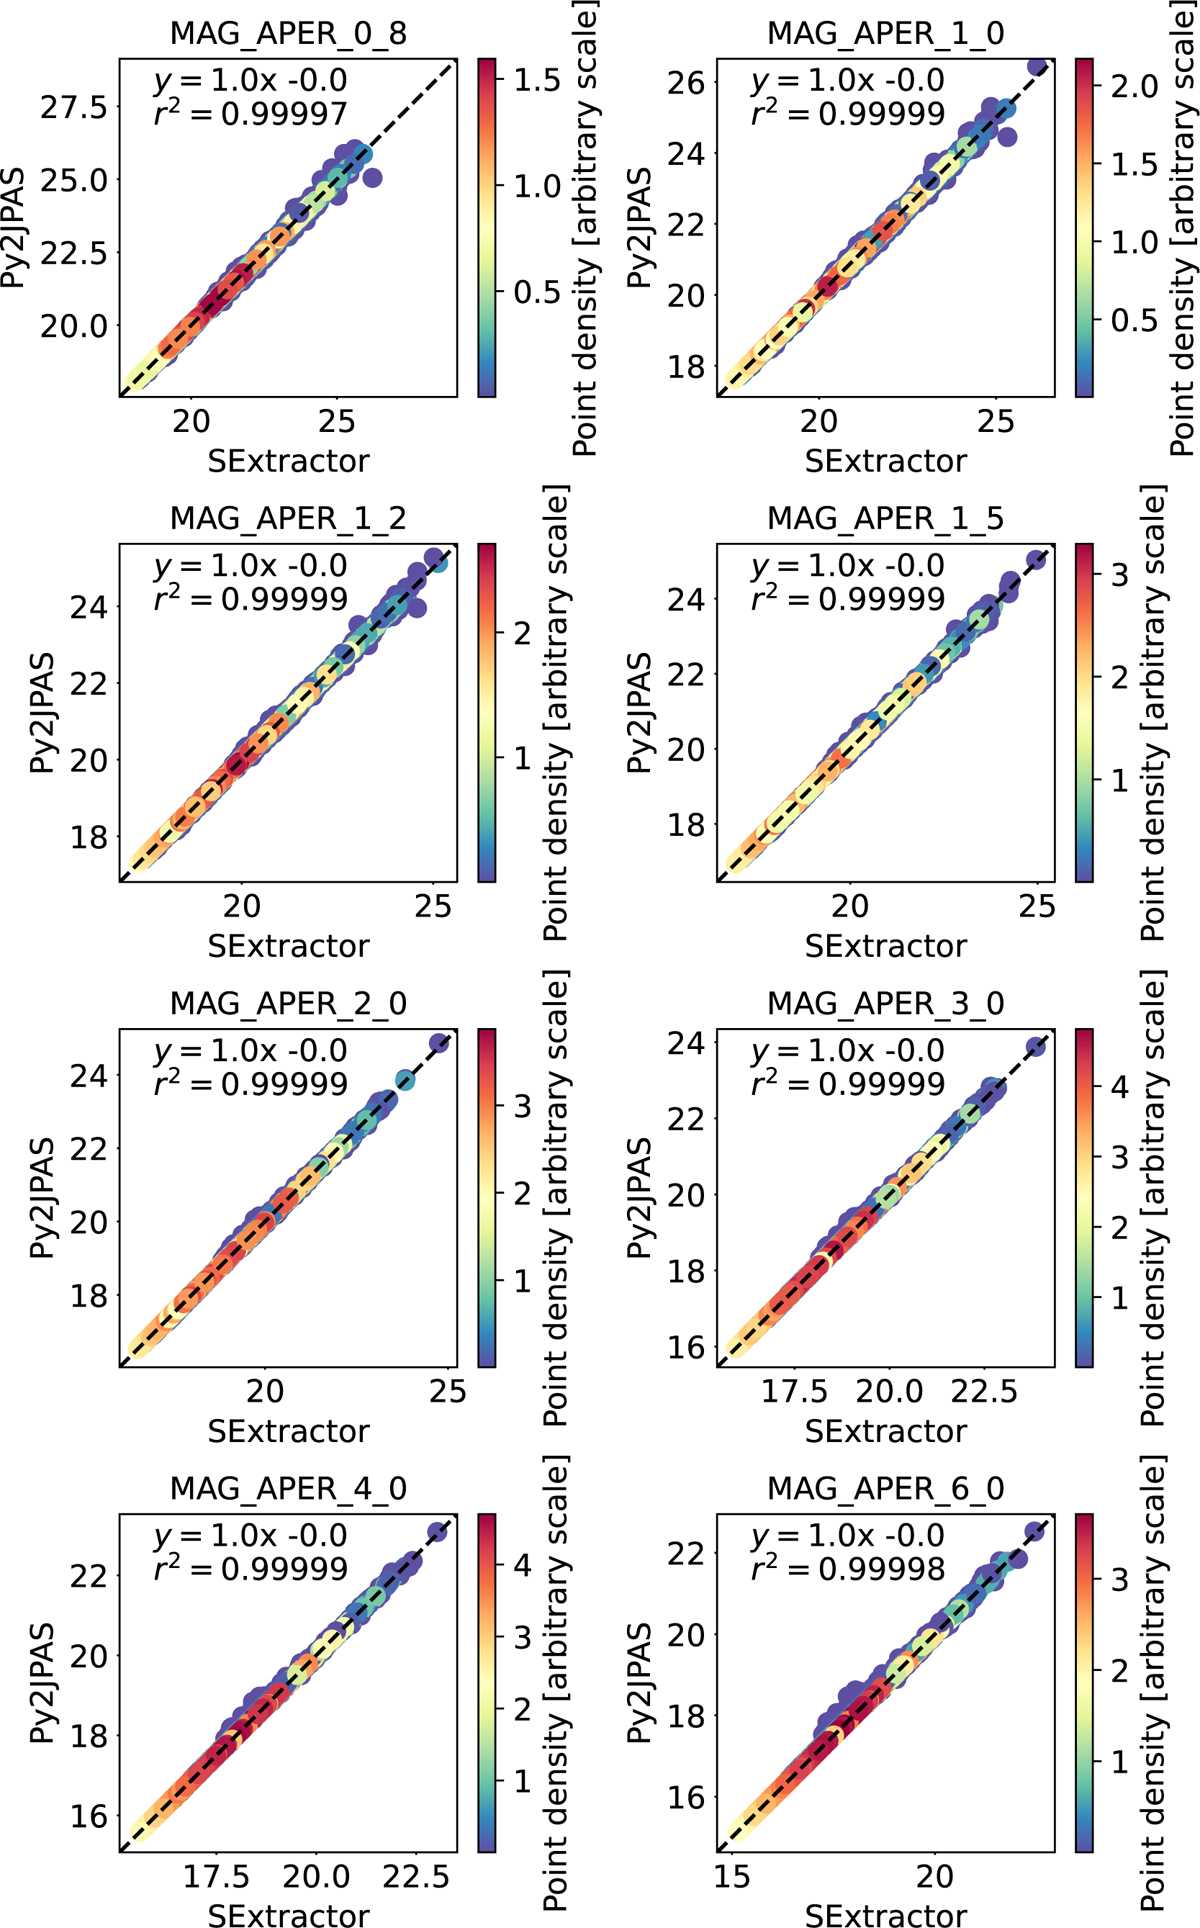
Comparison of the circular photometry of the catalogue and the one obtained with our methodology for the spatially resolved galaxies in miniJPAS. Each point represents one filter of one galaxy. The colour-scale represents the density of points. The black dashed line represents the one-to-one relation.
Current usage metrics show cumulative count of Article Views (full-text article views including HTML views, PDF and ePub downloads, according to the available data) and Abstracts Views on Vision4Press platform.
Data correspond to usage on the plateform after 2015. The current usage metrics is available 48-96 hours after online publication and is updated daily on week days.
Initial download of the metrics may take a while.