Fig. 4
Download original image
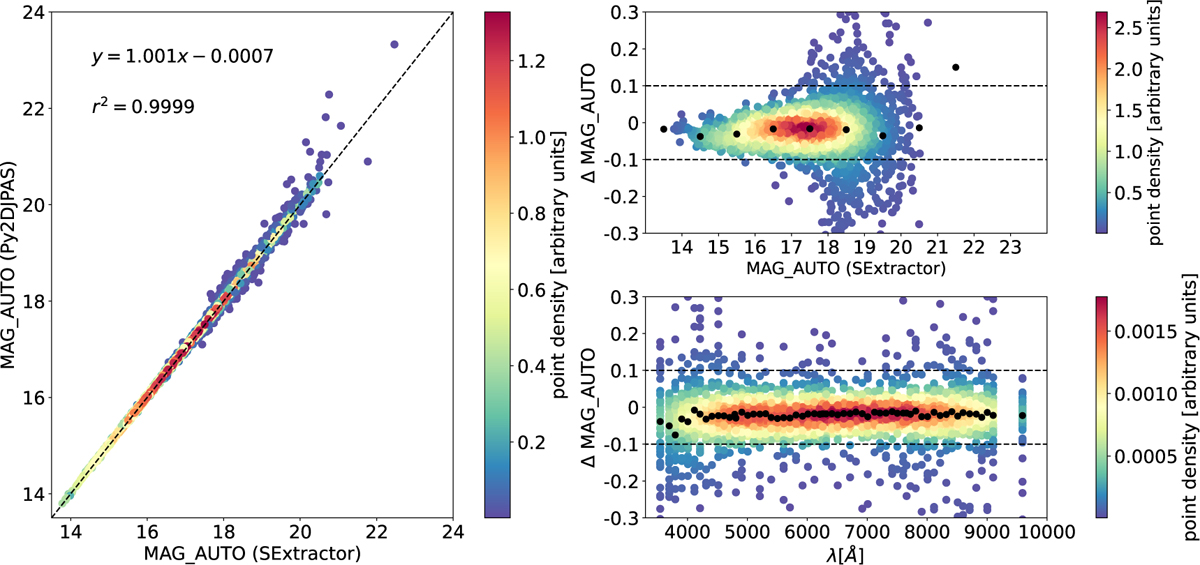
Comparison of the MAG_AUTO photometry of the catalogue and the one obtained with our methodology. The left panel shows the one-to-one relation. The upper-right panel shows the difference of the magnitudes (SExtractor-Py2DJPAS) for each filter for each galaxy as a function of the magnitude of the band. The bottom-right panel shows the difference for each filter for each galaxy as a function of the pivot wavelength of the filter. The colour-scale represents the density of points. Black points represent the median value in each brightness bin and wavelength bin.
Current usage metrics show cumulative count of Article Views (full-text article views including HTML views, PDF and ePub downloads, according to the available data) and Abstracts Views on Vision4Press platform.
Data correspond to usage on the plateform after 2015. The current usage metrics is available 48-96 hours after online publication and is updated daily on week days.
Initial download of the metrics may take a while.