Fig. 7
Download original image
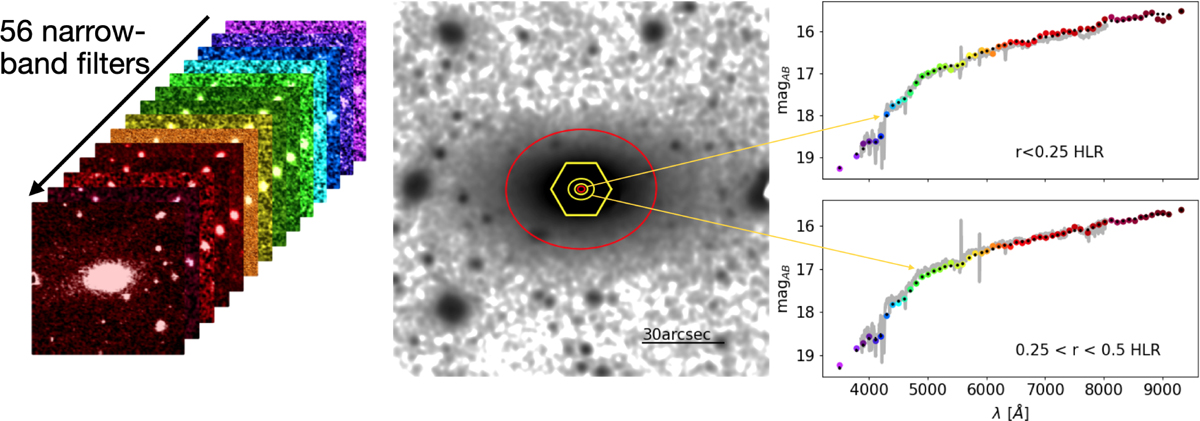
IFU-like capabilities of the J-PAS data. First panel: representation of the different filter images contained in a data cube from miniJPAS. The colour of each slide represents the band. Second panel: flux image in the rSDSS band of the galaxy 2470-10239. The innermost red ellipse shows the FWHM of the worst PSF. The outermost red ellipse shows the distance at which J-spectra with a median S/N>5 in the filters with λpivot<5000 Å can be obtained, using elliptical annuli, when increasing their semimajor axis in steps of the FWHM of the worst PSF. The yellow hexagon shows the FoV of the larges MaNGA IFU. Yellow ellipses show the matching apertures with MaNGA data, using the HLR calculated by PyCASSO on the MaNGA data cube (r<0.25 HLR and 0.25<r<0.5 HLR). Right: comparison of the miniJPAS and MaNGA data in those apertures. Grey lines represent the MaNGA spectroscopic data. Colour points represent the miniJPASdata. Black points represent the SED fitting obtained with BaySeAGal.
Current usage metrics show cumulative count of Article Views (full-text article views including HTML views, PDF and ePub downloads, according to the available data) and Abstracts Views on Vision4Press platform.
Data correspond to usage on the plateform after 2015. The current usage metrics is available 48-96 hours after online publication and is updated daily on week days.
Initial download of the metrics may take a while.