Fig. 8
Download original image
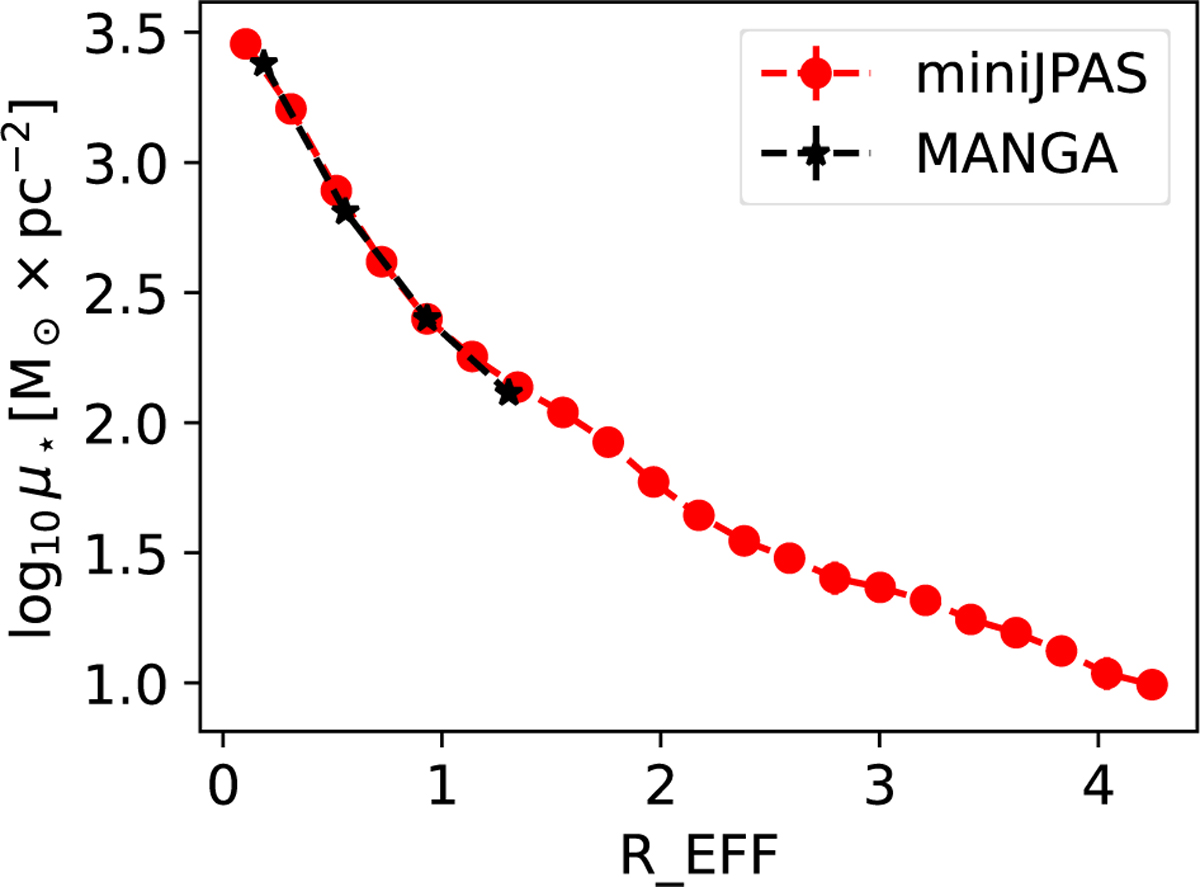
Comparison of the radial profiles of the stellar mass density of the galaxy 2470–10239 obtained with our methodology and with MaNGA data. Red dots represent the profile obtained with Py2DJPAS and BaySeAGal using the data from miniJPAS. Black stars represent results obtained with Pycasso and starlight using the data from MaNGA.
Current usage metrics show cumulative count of Article Views (full-text article views including HTML views, PDF and ePub downloads, according to the available data) and Abstracts Views on Vision4Press platform.
Data correspond to usage on the plateform after 2015. The current usage metrics is available 48-96 hours after online publication and is updated daily on week days.
Initial download of the metrics may take a while.