Fig. 9
Download original image
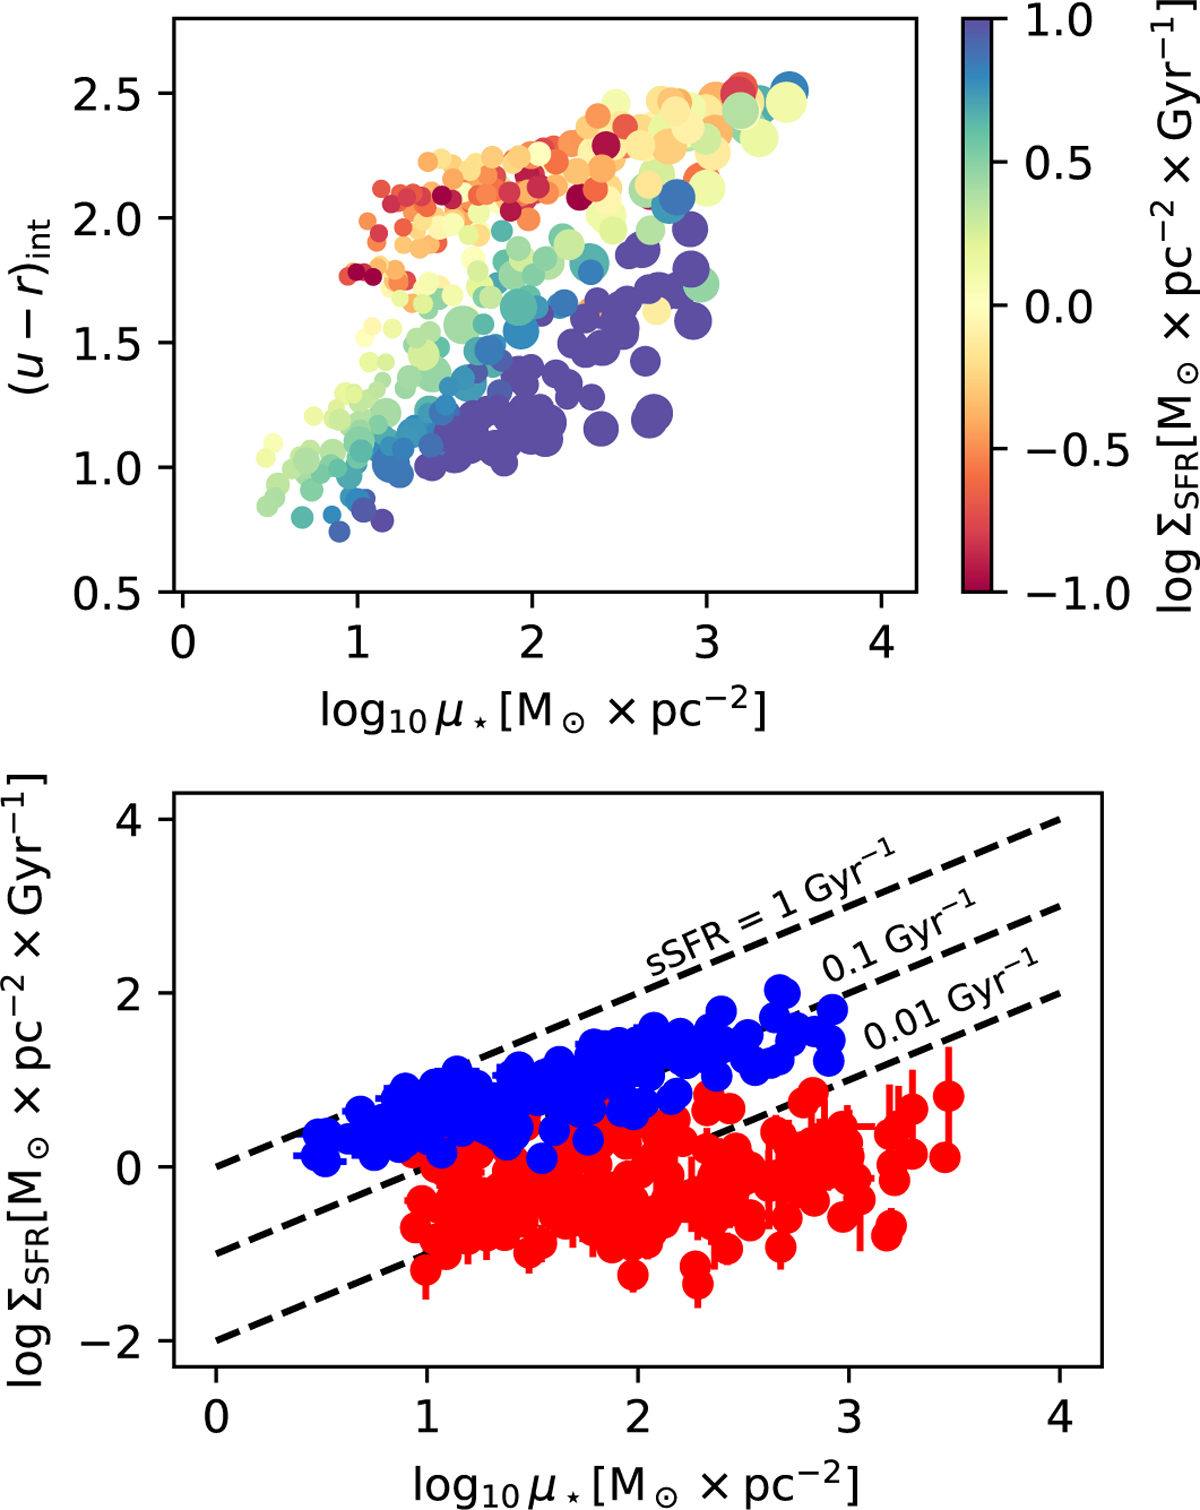
Stellar mass density, colour, and ΣSFR relation. Top panel: Stellar mass surface density-colour diagram, colour coded by ΣSFR. Each point represents the values obtained for an aperture area. Bottom panel: local SFMS. Red points represent red galaxies. Blue points represent blue galaxies. Black dashed lines represent loci of constant sSFR, with sSFR=0.01, 0.1, and 1 Gyr1, respectively.
Current usage metrics show cumulative count of Article Views (full-text article views including HTML views, PDF and ePub downloads, according to the available data) and Abstracts Views on Vision4Press platform.
Data correspond to usage on the plateform after 2015. The current usage metrics is available 48-96 hours after online publication and is updated daily on week days.
Initial download of the metrics may take a while.