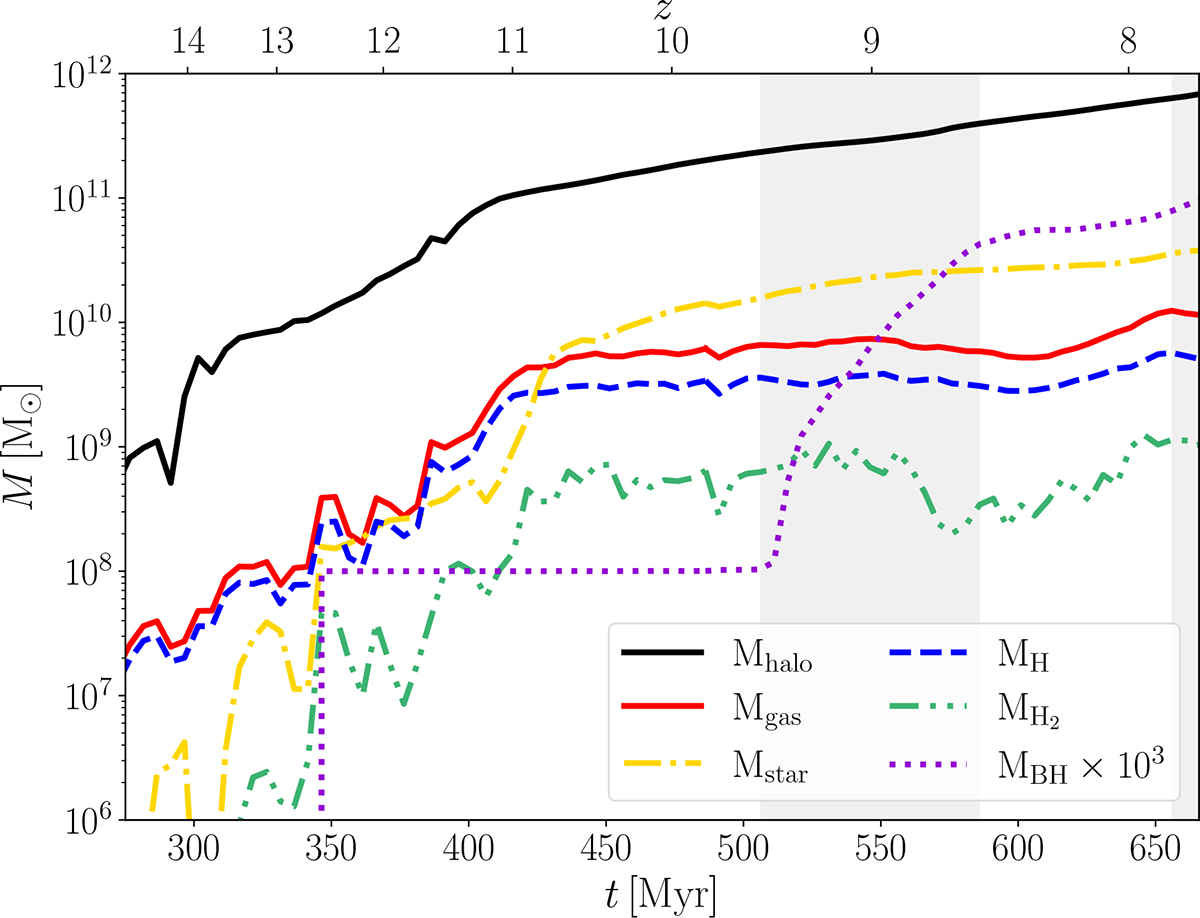
Fig. 1.
Download original image
Evolution of different components of the target galaxy. The solid black line corresponds to the halo mass (up to the virial radius), the dash-dotted gold one to the mass in stars, the solid red line to the total gas mass, the dashed blue line to the atomic hydrogen (H) mass content, the dash-double-dotted green line to the molecular hydrogen (H2) mass content, and, finally, the dashed purple line to the black hole mass, scaled up by three orders of magnitude for visualisation purposes. With the grey shaded areas, we highlight distinct phases during the MBH accretion history: (i) super-Eddington accretion phases in the range 8.6 ≲ z ≲ 9.5, and (ii) accretion around the Eddington limit at z ≲ 7.9.
Current usage metrics show cumulative count of Article Views (full-text article views including HTML views, PDF and ePub downloads, according to the available data) and Abstracts Views on Vision4Press platform.
Data correspond to usage on the plateform after 2015. The current usage metrics is available 48-96 hours after online publication and is updated daily on week days.
Initial download of the metrics may take a while.