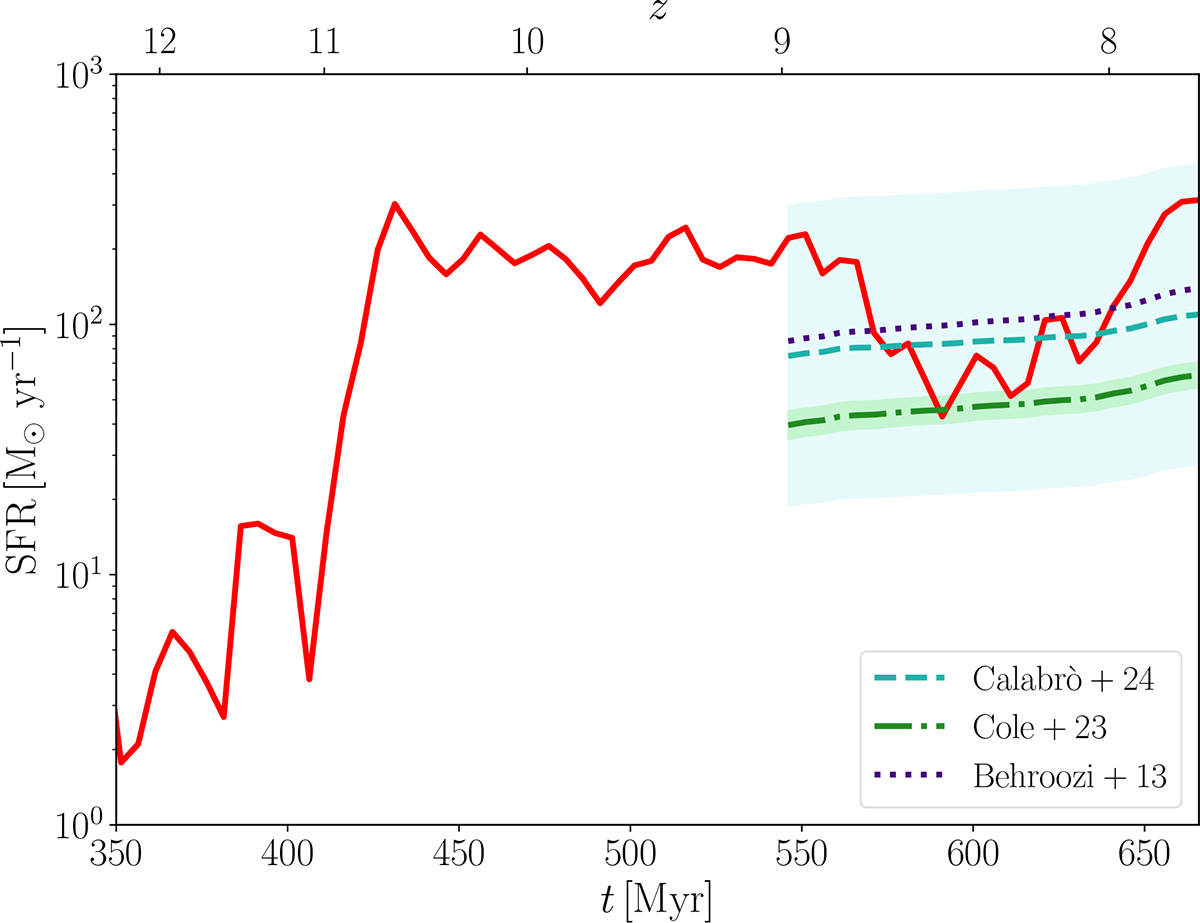
Fig. 2.
Download original image
Evolution of the SFR of the target galaxy (as a solid red line). The best fit of the evolution obtained from the CEERS (Cole et al. 2025) – which explicitly excluded sources potentially contaminated by AGNs – and the GLASS (Calabrò et al. 2024) surveys are shown below z ≃ 9 as dot-dashed green and dashed turquoise lines, respectively. We also report the 1σ scatter as shaded areas, following the same colour scheme. The dotted purple line corresponds instead to the best fit to the empirical model by Behroozi et al. (2013).
Current usage metrics show cumulative count of Article Views (full-text article views including HTML views, PDF and ePub downloads, according to the available data) and Abstracts Views on Vision4Press platform.
Data correspond to usage on the plateform after 2015. The current usage metrics is available 48-96 hours after online publication and is updated daily on week days.
Initial download of the metrics may take a while.