Fig. 5.
Download original image
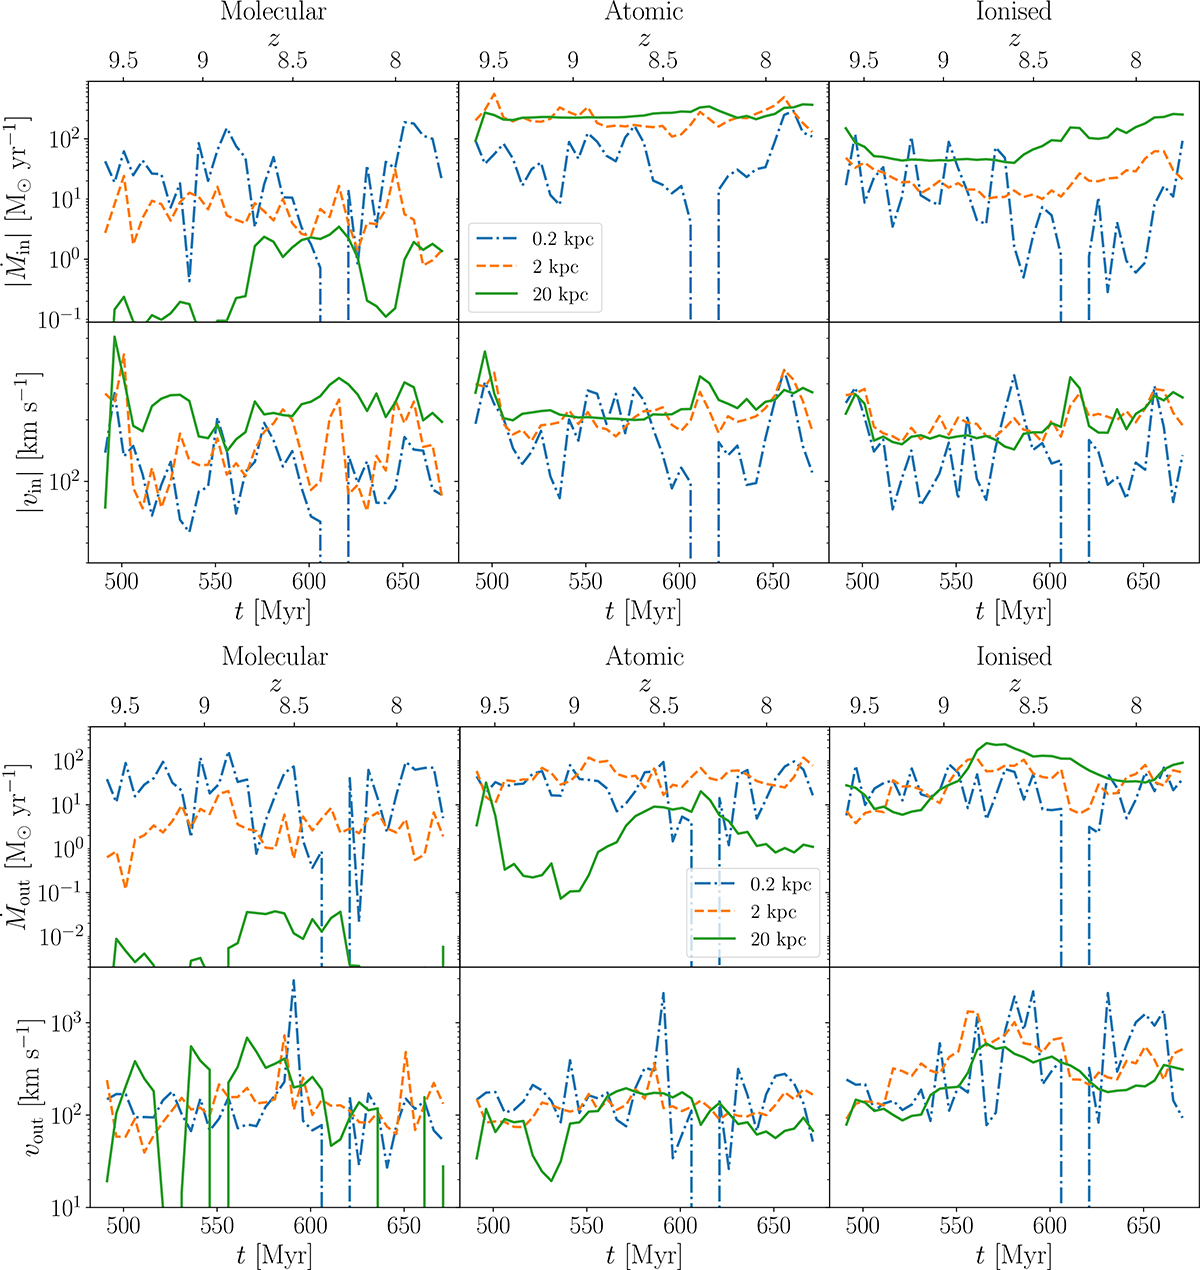
Top panels: Inflow mass rates (first row) and average radial velocities (second row) for the molecular (left), atomic (middle), and ionised (right) gas phases. The solid green lines represent inflows at 20 kpc, the dashed orange lines at 2 kpc, and the dot-dashed blue lines at 0.2 kpc. Bottom panels: Same as above but for outflows.
Current usage metrics show cumulative count of Article Views (full-text article views including HTML views, PDF and ePub downloads, according to the available data) and Abstracts Views on Vision4Press platform.
Data correspond to usage on the plateform after 2015. The current usage metrics is available 48-96 hours after online publication and is updated daily on week days.
Initial download of the metrics may take a while.