Fig. 8.
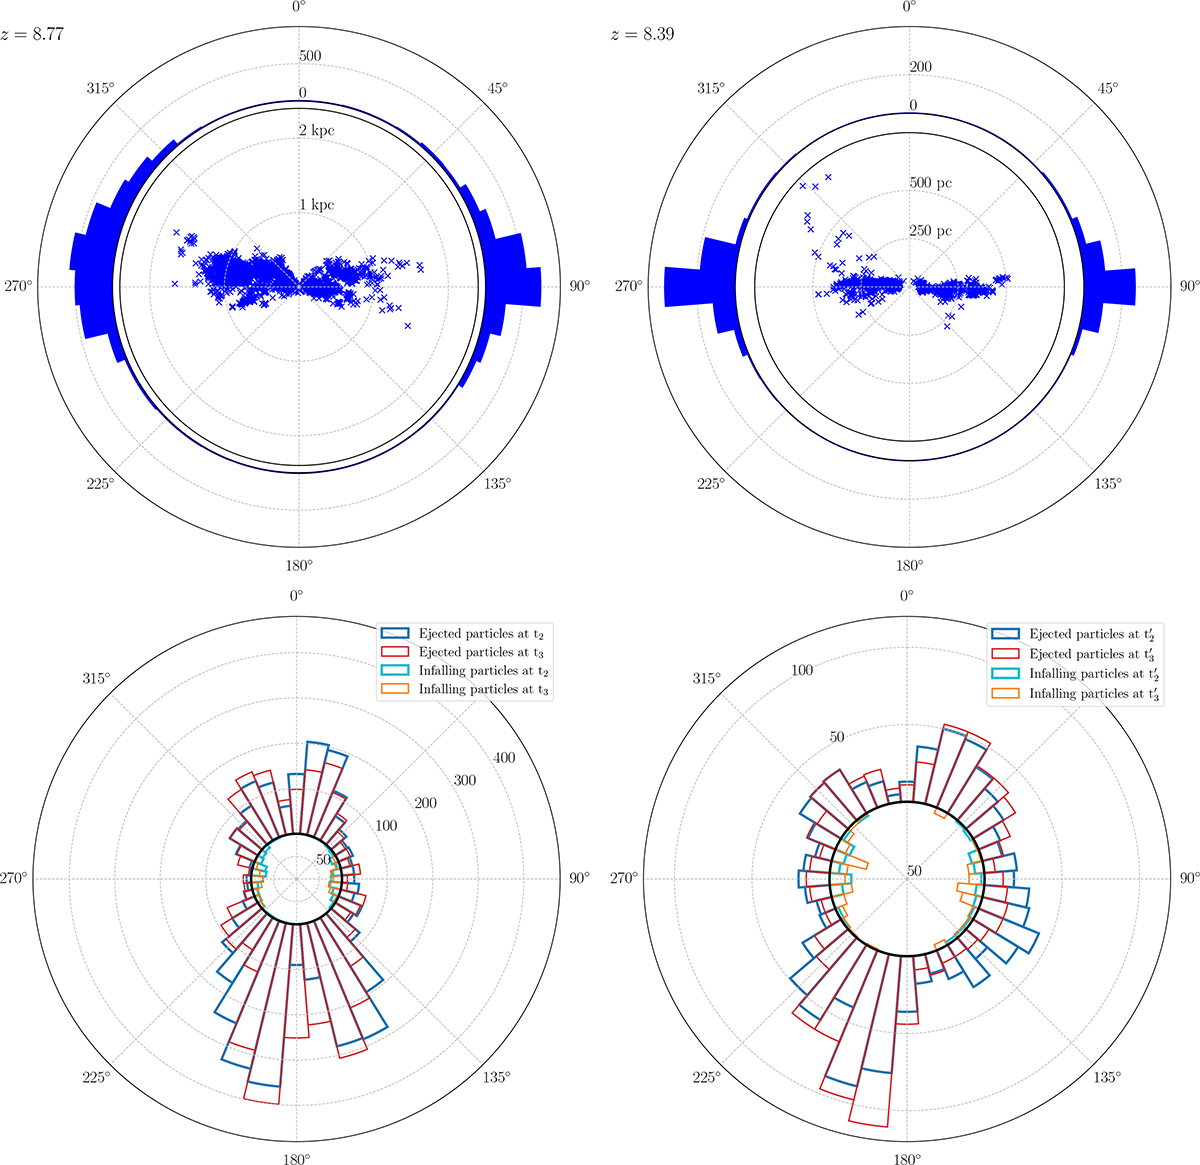
Download original image
Top row: Spatial distribution of the gas particles ejected by MBH feedback at z ∼ 8.77 (left-hand side) and immediately prior to the cavity opening, at z ∼ 8.39, (right-hand side). The distances of the particles from the MBH are shown in the inner circle, whereas the angular distribution histogram is reported in the outer ring. An angle of 0° corresponds to the z-axis orthogonal to the galactic disc. Bottom row: Histograms of the ejected particle angular distribution (as number of particles) immediately after the MBH feedback event (t2 and t2′) and after 5 Myr (t3 and t3′). Outflowing particles are shown in blue and red respectively, while infalling ones are identified with cyan and orange.
Current usage metrics show cumulative count of Article Views (full-text article views including HTML views, PDF and ePub downloads, according to the available data) and Abstracts Views on Vision4Press platform.
Data correspond to usage on the plateform after 2015. The current usage metrics is available 48-96 hours after online publication and is updated daily on week days.
Initial download of the metrics may take a while.