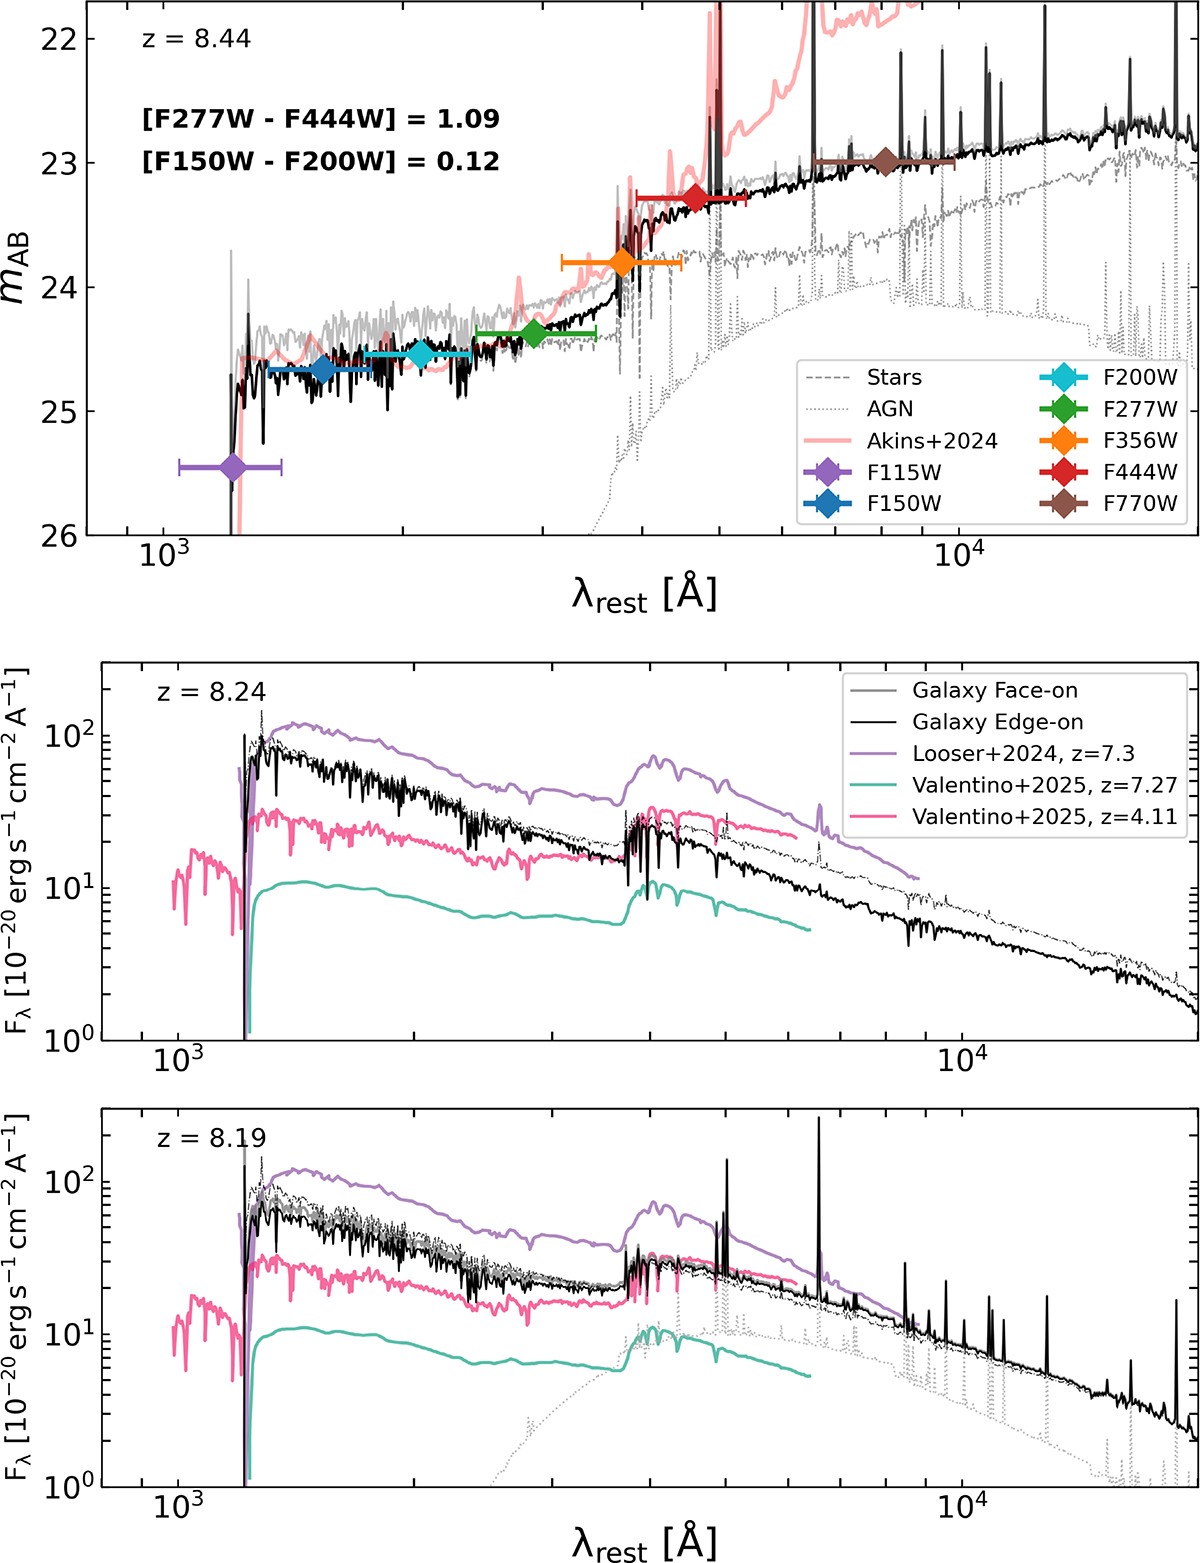
Fig. 9.
Download original image
Top panel: Emerging galaxy spectrum at the end of the sustained super-Eddington growth phase as a function of the rest frame wavelength for edge-on (solid black line) and face-on (solid grey line) lines of sight. The stellar and AGN contributions (when present) are shown by dashed and dotted grey lines, respectively. Overplotted in different colours is the expected galaxy photometry in several JWST NIRCam and MIRI wide filters, which trace the rest-frame UV and optical emission. For comparison, we also show the median-stacked SED of LRDs observed in the COSMOS-Web survey, obtained from Akins et al. (2025) with a solid red line. Central and bottom panels: Emerging galaxy spectrum after ≈ 5 Myr (z = 8.24) and 10 Myr (z = 8.19) from the formation of the cavity shown in Fig. 4. For comparison, we include spectra of high-redshift systems recently observed undergoing phases of galaxy quenching (Valentino et al. 2025, z = 4.11 and 7.27) or mini-quenching (Looser et al. 2024, z = 7.3). For reference, in the central and bottom panels we report the galaxy specific flux at z = 8.44 as a thin dash-dotted black line. All spectra are rescaled to match the mass and redshift of the simulated galaxy.
Current usage metrics show cumulative count of Article Views (full-text article views including HTML views, PDF and ePub downloads, according to the available data) and Abstracts Views on Vision4Press platform.
Data correspond to usage on the plateform after 2015. The current usage metrics is available 48-96 hours after online publication and is updated daily on week days.
Initial download of the metrics may take a while.