Fig. 2
Download original image
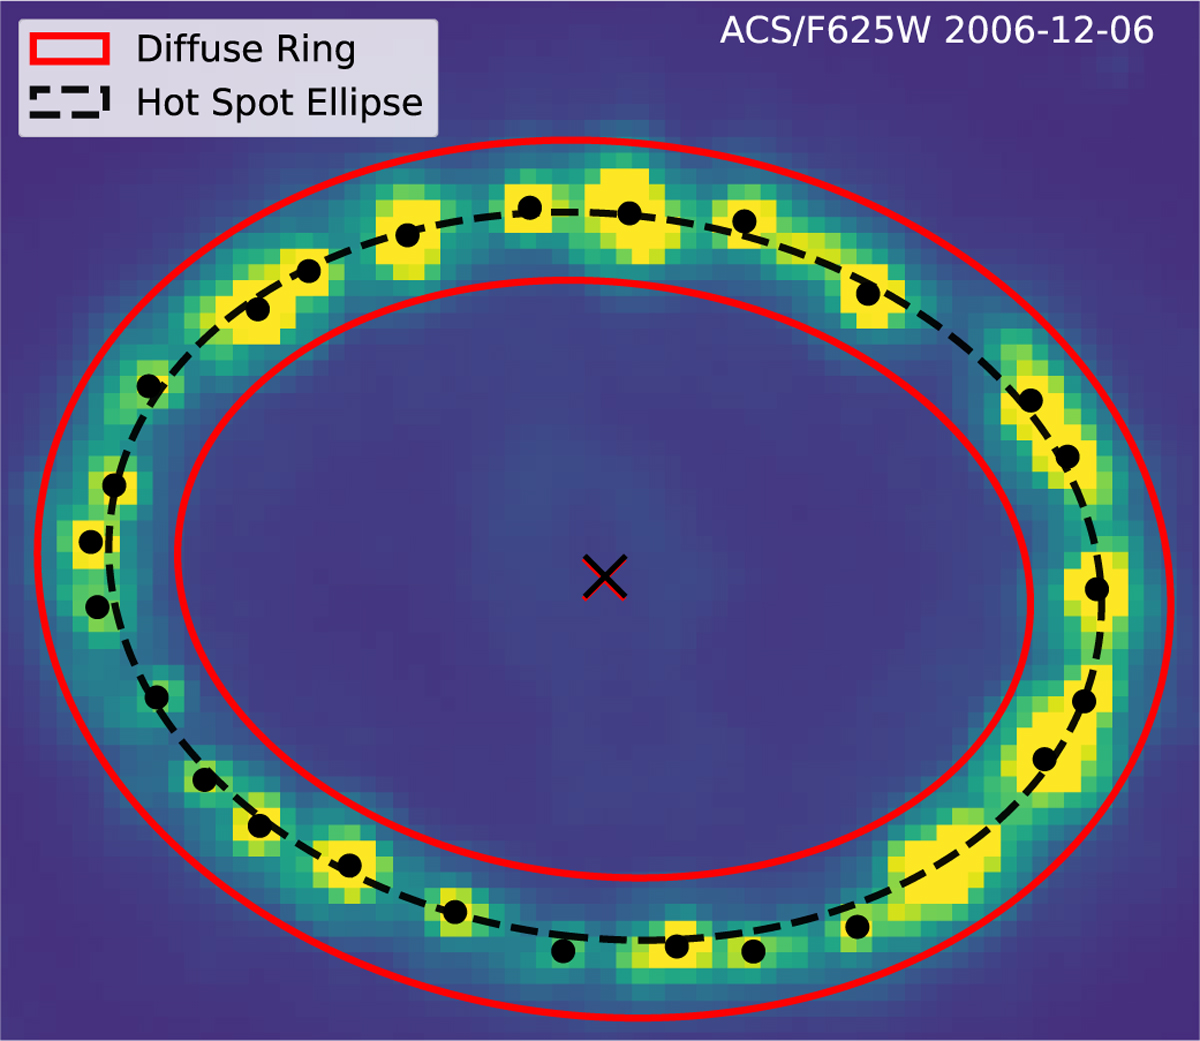
HST image of the ER at day 7226. The red annulus represents the fitted diffuse ring model, plotted with a width of 2σ. The black points represent the fitted hot spot centroids, while the dashed black ellipse represents the fitted ellipse around the hot spot centroids. Both methods give an estimate of the center of the ER, showcased as a black and red cross mark for the hot spot ellipse and diffuse ring, respectively.
Current usage metrics show cumulative count of Article Views (full-text article views including HTML views, PDF and ePub downloads, according to the available data) and Abstracts Views on Vision4Press platform.
Data correspond to usage on the plateform after 2015. The current usage metrics is available 48-96 hours after online publication and is updated daily on week days.
Initial download of the metrics may take a while.