Fig. 3
Download original image
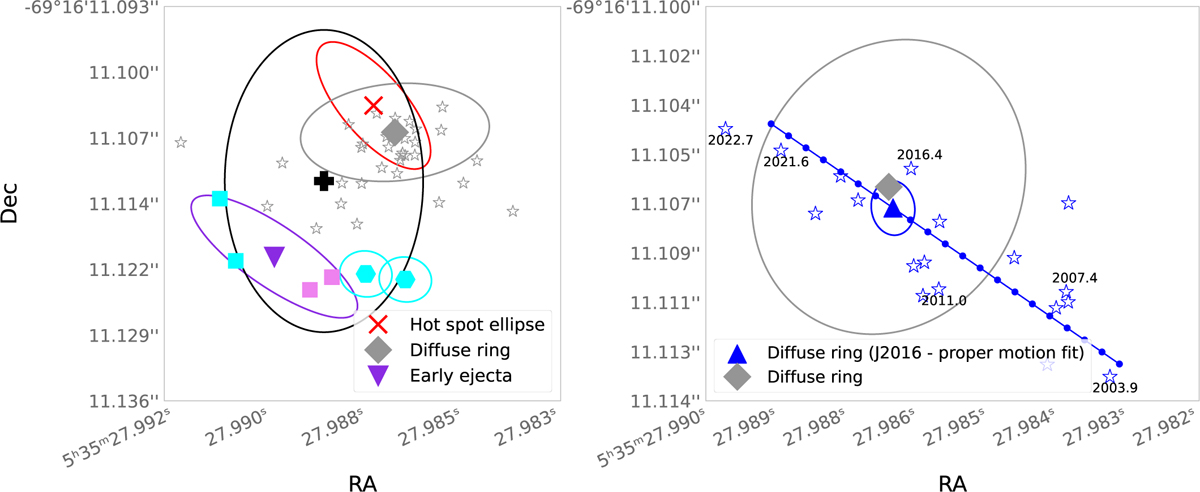
SN 1987A position estimates and astrometric trajectory. Left panel: celestial coordinates of SN 1987A determined from the HST images. The gray hollow stars correspond to the diffuse ring positions after image registration onto the Gaia DR3 frame, without correcting for the proper motion of the reference stars. The gray diamond shows the weighted average of the diffuse ring positions. The red “×” marker and its ellipse are the weighted average of the hot spot ellipse positions and the 68.3% confidence region, respectively (individual points omitted). The pink and cyan squares show the F175W (X0C80102T, X0C80103T) and F501N (X0C80106T, X0C80107T) ejecta positions, respectively. The cyan hexagons are the F501N (X0C80106T, X0C80107T) diffuse ring positions with their registration and fitting uncertainties. The upside-down purple triangle is the average of the four early ejecta positions. The black cross marks the final position, derived as the average of the mean diffuse ring and early ejecta position. The black ellipse shows the total uncertainty, corresponding to their positional discrepancy. Right panel: time evolution of the average diffuse ring position at each epoch. The blue hollow stars show the diffuse ring center at each observational epoch, which are obtained after registering the images by accounting for the proper motion of the reference stars. For clarity, the early WFPC2 points are omitted due to their larger uncertainties and small contribution to the fit. The blue triangle marks the J2016 position from the best-fit astrometric trajectory, together with its 68.3% confidence region. The gray diamond and its ellipse are the same as in the left panel but appear different due to the differing aspect ratios. The blue circles show the predicted positions from the best-fit trajectory of SN 1987A annually (from J2003 to J2023). The solid segments connect these points and represent the predicted proper motion from the best-fit trajectory.
Current usage metrics show cumulative count of Article Views (full-text article views including HTML views, PDF and ePub downloads, according to the available data) and Abstracts Views on Vision4Press platform.
Data correspond to usage on the plateform after 2015. The current usage metrics is available 48-96 hours after online publication and is updated daily on week days.
Initial download of the metrics may take a while.