Fig. 5
Download original image
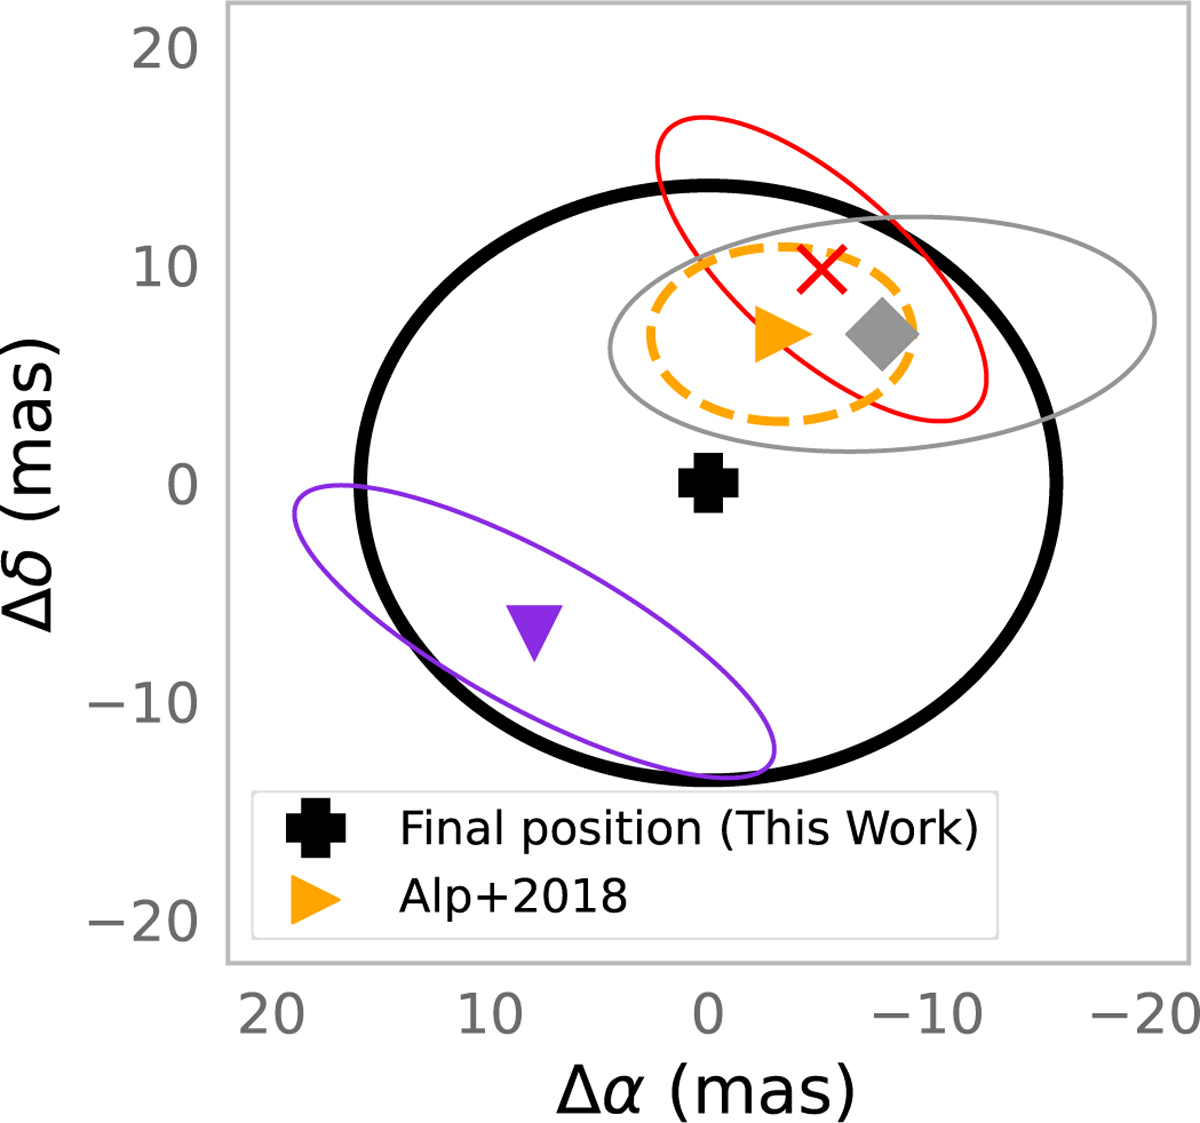
Individual positions relative to final explosion center. The black cross shows the favored final position ![]() (ICRS J2016). The black circle indicates the total uncertainty, defined as the offset between the mean early ejecta and mean diffuse ring positions. The upside-down purple triangle marks the average early ejecta position; the red “×” marker shows the average hot spot ellipse position; the gray diamond indicates the average diffuse ring position. Their corresponding ellipses represent 68.3% confidence regions. The right orange triangle shows the position from Alp et al. (2018), corrected from J2015 (
(ICRS J2016). The black circle indicates the total uncertainty, defined as the offset between the mean early ejecta and mean diffuse ring positions. The upside-down purple triangle marks the average early ejecta position; the red “×” marker shows the average hot spot ellipse position; the gray diamond indicates the average diffuse ring position. Their corresponding ellipses represent 68.3% confidence regions. The right orange triangle shows the position from Alp et al. (2018), corrected from J2015 (![]() ) to J2016 (
) to J2016 (![]() ) using the estimated proper motion of SN 1987A.
) using the estimated proper motion of SN 1987A.
Current usage metrics show cumulative count of Article Views (full-text article views including HTML views, PDF and ePub downloads, according to the available data) and Abstracts Views on Vision4Press platform.
Data correspond to usage on the plateform after 2015. The current usage metrics is available 48-96 hours after online publication and is updated daily on week days.
Initial download of the metrics may take a while.