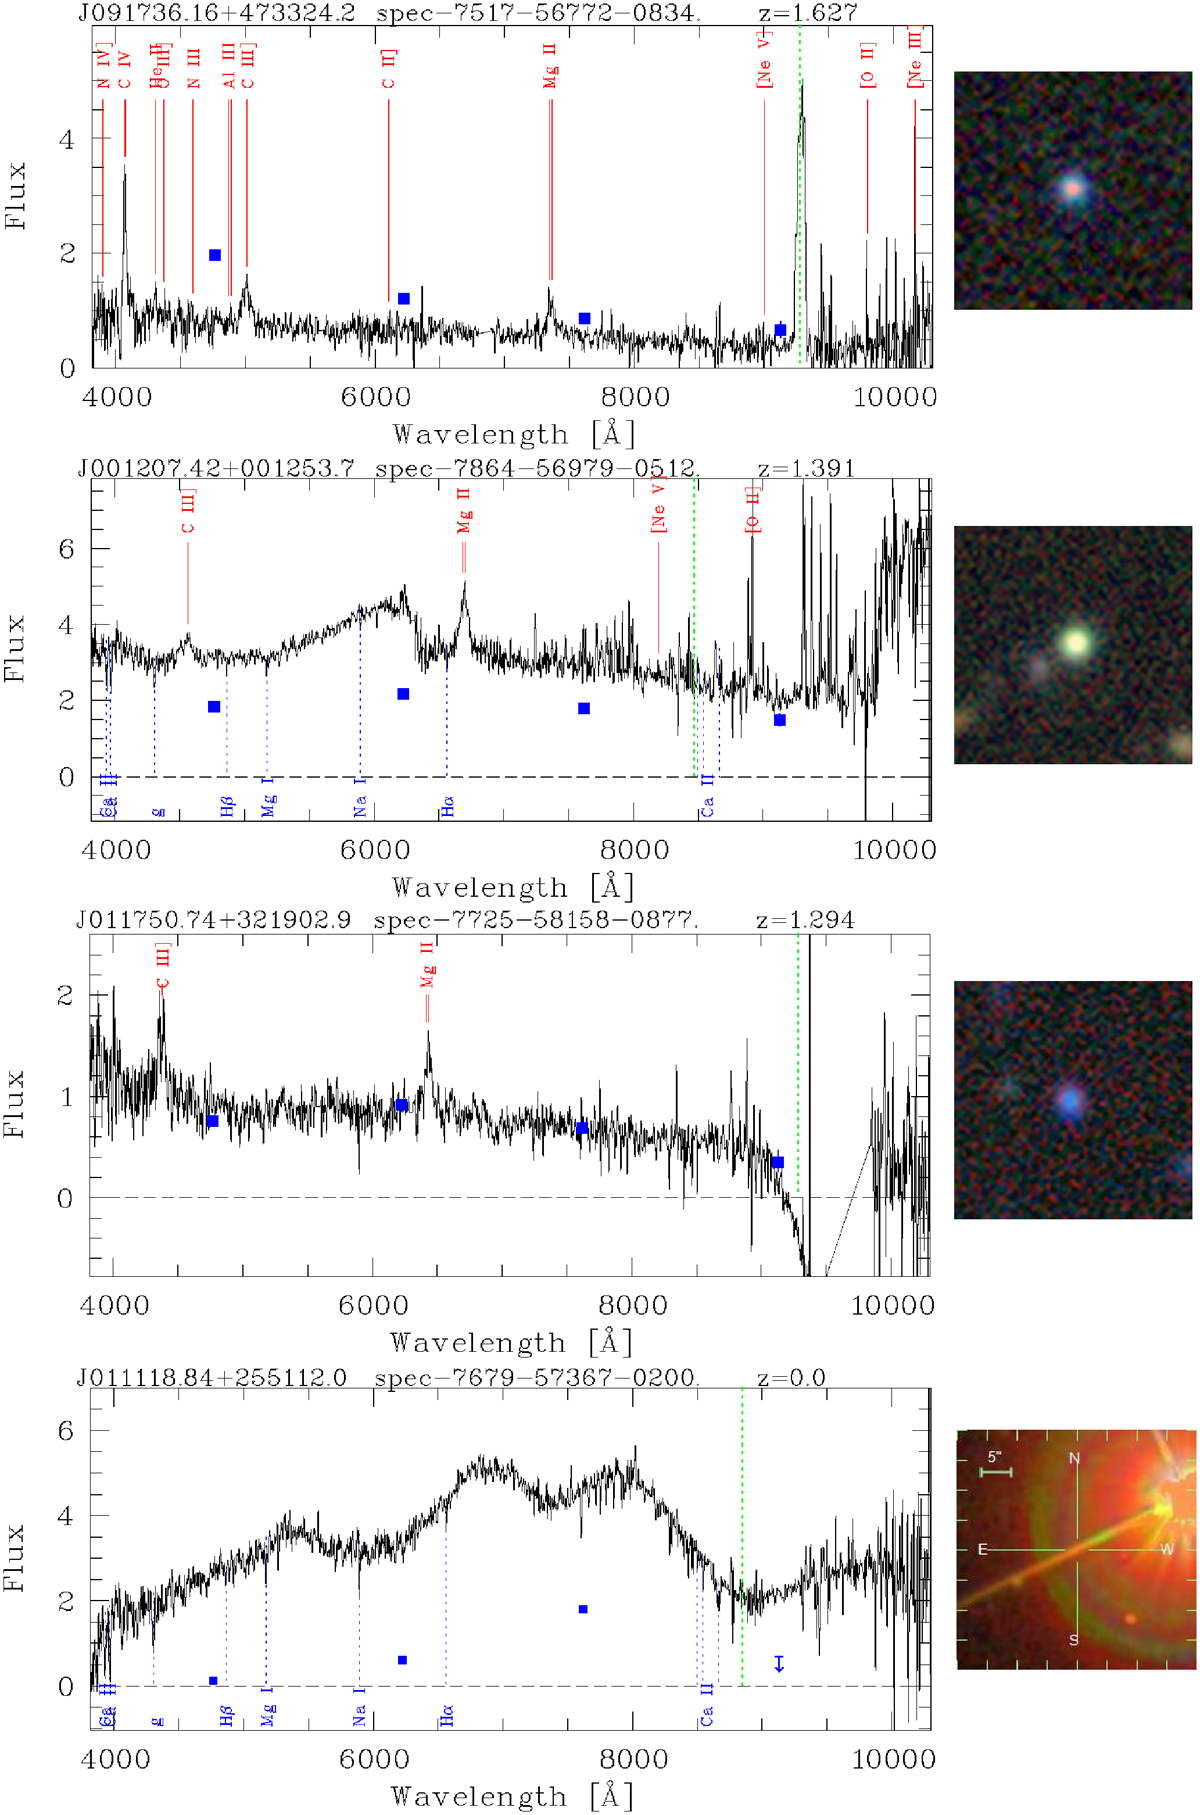
Fig. 1.
Download original image
Four examples of problematic spectra with special features that can significantly influence automated classification (see text). Emission lines are labelled at the top, absorption lines at the bottom. The vertical green lines in the spectra plots mark the positions of the Ly α line for the redshift from the SDSS. The blue squares indicate fluxes derived from SDSS photometry. The image of J011118 is from the SDSS; all others are from the LS (15 arcsec side length).
Current usage metrics show cumulative count of Article Views (full-text article views including HTML views, PDF and ePub downloads, according to the available data) and Abstracts Views on Vision4Press platform.
Data correspond to usage on the plateform after 2015. The current usage metrics is available 48-96 hours after online publication and is updated daily on week days.
Initial download of the metrics may take a while.